


Transformation Rate: A Measure of Degree of Transformation
 Mike Taylor Updated: Dec 3, 2025 Reading time ≈ 7 min
Transformation Rate is a metric used to measure how much participants change as a result of a program, course, or intervention.
This change can affect:
- perspectives and beliefs,
- attitudes and motivation,
- learning goals and career plans,
- confidence in applying new skills.
It complements classical educational metrics (test scores, completion) and fits nicely into quantitative research and qualitative research on learning outcomes.
If you're running educational programs, workshops, or coaching, Transformation Rate can be a powerful complement to classic metrics like course satisfaction and learning outcome surveys.
What the Transformation Rate is Used For
Transformation Rate is especially valuable in education, training, coaching, and transformation-focused programs (career changes, leadership development, personal development etc.). Typical uses include:
1. Evaluating learning effectiveness
Instructors and organizations use Transformation Rate to understand:
- whether learners reach their goals,
- how much their plans or attitudes shift,
- if the program actually changes anything in real life (not just on paper).
Combined with other signals (skills tests, post-training feedback), it provides a more complete picture of effectiveness.
2. Improving program design
Combined with Gap Analysis, Transformation Rate highlights:
- which modules or activities spark the most change,
- where learners struggle or disengage,
- which goals remain unmet.
Course designers can use this metric to refine content, add more practice or coaching, and adjust pacing for better outcomes.
3. Supporting funding and investment decisions
For schools, universities, non-profits, or corporate L&D teams, a high Transformation Rate:
- justifies continued funding,
- helps secure grants or sponsorships,
- strengthens the business case for scaling a program.
It signals that the program delivers real, measurable value - not just attendance numbers.
4. Marketing and participant acquisition
Transformation Rate results (and stories behind them) can power:
- case studies on landing pages,
- testimonials,
- "before/after" impact summaries.
Instead of generic claims, you can say: "87% of participants reached their original goals or significantly shifted their plans after this course." This is compelling proof in course pages and post-course feedback campaigns.
5. Personalizing learning
By analyzing who transforms and how, you can:
- design different tracks for beginners vs. advanced learners,
- build personalized learning paths,
- identify learners who need extra support.
Transformation Rate becomes one of the inputs into adaptive learning strategies.
6. Academic and educational research
Used in experimental research with random assignment or in panel studies and longitudinal studies with repeated measures.
How the Transformation Rate Metric is Calculated
One practical way to calculate Transformation Rate focuses on whether participants achieve their initial learning goals, while correctly handling those who changed goals mid-course.
The formula:
Transformation Rate = (Number of students who achieved their goal ÷ (Total number of students at the start − Number of students who changed their goals)) × 100%
Where:
- Number of students who achieved their goal – participants who met their original goals by the end.
- Total number of students at the start – all participants at the beginning.
- Number of students who changed their goals – those who significantly revised or replaced their original goals during the program.
By excluding goal-changers from the denominator, you focus on students whose goals remained stable and ask: "Of those who kept the same goal, how many actually achieved it?"
Example
- Total students at the start: 100
- Students who achieved their original goals: 80
- Students who changed their goals during the course: 10
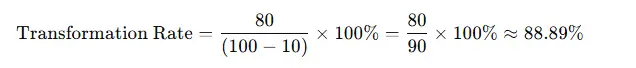
So, the Transformation Rate ≈ 88.89%, meaning that almost 9 out of 10 students with stable goals achieved what they initially set out to do.
Tip: You can also track secondary metrics, such as % of learners who changed their goals in a positive direction (e.g., more ambitious targets), using pre/post goal-setting surveys in SurveyNinja.
General Methodology for Measuring Transformation Rate
A structured process makes this metric reliable and actionable. A typical workflow:
1. Define what "transformation" means for your program
Decide which changes matter most:
- knowledge and skills,
- confidence and self-efficacy,
- career plans or goals,
- attitudes and beliefs about a topic.
Align these with your learning objectives.
2. Design pre- and post-program instruments
Create:
- Pre-course surveys to capture baseline goals, confidence, attitudes and expectations.
- Post-course surveys with parallel questions to measure change. You can start from a course evaluation template and add transformation-focused items.
3. Collect baseline data
Before the program starts, gather:
- initial goals,
- current skills or self-rating,
- expectations and motivations.
This is your reference point.
4. Deliver the course or program
Run the intervention as designed: content, activities, coaching, projects, etc.
5. Run the post-program survey
After completion, collect:
- goal achievement (yes/no/partially),
- whether goals have changed,
- shifts in confidence, attitudes, or plans,
- qualitative feedback (what changed and why).
6. Compare pre- and post-data
For each participant, analyze:
- whether they achieved their original goals,
- whether goals changed (and in what direction),
- how much their self-assessment scores moved.
7. Calculate Transformation Rate
Use the formula:
Transformation Rate = (Number of students who achieved their goal ÷ (Total number of students at the start − Number of students who changed their goals)) × 100%
You can treat transformation rate as a program-level KPI, and also look at subgroups (e.g., different cohorts, channels, or formats). For more advanced setups, teams sometimes use time series analysis, panel attrition checks and Z-tests to compare groups.
8. Interpret results and report
Put the numbers in context:
- program type and difficulty,
- learner profile,
- length and intensity of the course.
Present findings to stakeholders with charts and insights using SurveyNinja's reporting tools.
What is Considered a Normal Transformation Rate?
There is no universal "good" Transformation Rate. It depends heavily on:
- Field and complexity of the subject,
- Initial competence and motivation levels,
- Program duration and intensity,
- Goal types (knowledge-only vs mindset or career change).
Some rough guidelines:
Low Transformation Rate. May indicate limited impact or misalignment between goals and content. Possible reasons:
- overly ambitious or unclear goals,
- weak engagement,
- content not matching learners' real needs,
- ineffective teaching methods.
Moderate Transformation Rate. Often acceptable in complex domains or early-stage programs. Still, it's a signal to look for bottlenecks and quick wins.
High Transformation Rate. Suggests strong program effectiveness:
- many participants reach or surpass their initial goals,
- goals are realistic and well-supported,
- teaching, content, and support are aligned.
Instead of chasing an abstract "target number," it's better to:
- compare your Transformation Rate across cohorts and iterations,
- segment by learner type (beginner vs advanced, online vs offline),
- use trends over time to see if your program design decisions are working.
How to Improve the Transformation Rate Metric
If your Transformation Rate is lower than you'd like, you can systematically improve it using a mix of design, pedagogy, and support strategies:
1. Start with a thorough needs analysis. Talk to your target audience, run needs assessment surveys, and clarify:
- what they want,
- what they already know,
- what real-world problems they're trying to solve.
Align course goals with these insights.
2. Design adaptive learning paths. Where possible:
- offer different tracks or levels,
- allow learners to select focus areas,
- adjust difficulty based on pre-test results.
3. Use interactive and experiential methods. Replace passive lectures with:
- projects and capstones,
- case studies,
- simulations,
- peer feedback and group work.
These methods deepen engagement and increase the likelihood of real transformation.
4. Provide regular and constructive feedback. Give learners:
- quick feedback on assignments and quizzes,
- guidance on how to close gaps,
- checkpoints to revisit or refine their goals.
You can automate part of this with checkpoint surveys and reflections.
5. Support motivation and engagement. Use:
- small milestones and visible progress markers,
- gamification elements (badges, levels, streaks),
- community features or group challenges,
- stories and examples that show real-world impact.
6. Leverage modern educational technologies. Integrate:
- LMS tools,
- interactive content platforms,
- survey and feedback loops via SurveyNinja,
- analytics dashboards to track participation and outcomes.
7. Continuously iterate based on data. After each cohort:
- review Transformation Rate and related metrics,
- analyze open-ended feedback,
- identify content that consistently confuses or bores learners,
- update examples, exercises, and pacing.
8. Invest in instructor development. Train instructors in:
- active learning techniques,
- coaching and feedback,
- online facilitation (if relevant),
- tools that support personalization and engagement.
By systematically measuring and improving Transformation Rate, you move beyond "people attended the course" and into "this program actually changed how people think, plan, and act."
If you'd like to implement this metric in your own programs, you can start by building pre- and post-course surveys in SurveyNinja, using templates like training feedback surveys and student goal-tracking surveys, then adding a transformation-focused block and tracking the metric cohort after cohort.
Updated: Dec 3, 2025 Published: Jun 2, 2025