 25 Questions for a Travel Agency Customer Satisfaction Survey

Viewing the Survey Report
Updated
On this page
The report shows the results for each question: how many people answered, how the answers split, and a chart. To read individual responses, use Responses instead. See Viewing and Downloading Survey Responses.
Opening the report
- Open the survey and click Results in the top menu.
- In the second row, click Reports.

The same row has three more tabs:
- Summary: visits, completed and incomplete responses, completion rate, responses by day, devices and geography. See Survey Summary.
- Responses: each response separately.
- Smart Analytics: a report written by AI (Premium and higher). See Smart Analytics: AI Report on Responses.
Choosing which responses to count
Above the report, choose whose responses are counted (1):
- Completed: respondents who finished the survey.
- Incomplete: respondents who started but didn't finish. See Incomplete Responses.
- Disqualified: respondents screened out by the survey logic.
- All: everyone together.
Incomplete, Disqualified and All are available on the Standard plan and higher.
Reading a question card
Each question has its own card with a chart and numbers under the title:
- Answered: how many respondents answered the question.
- Skipped: how many respondents skipped the question.
- Impressions: how many times the question was shown.
- Had difficulty answering: appears if the question has this option.
- Average response time: how long respondents spent on the question.
For a file upload question, the card shows Total files instead.
To change the chart, use the view buttons on the card (2): List, Bars, Table, Donut, Cards and others. The set of views depends on the question type.
The bar above the cards changes all of them at once: sort the options in Default order, Highest to lowest or Lowest to highest, and show Numbers and percentages, Numbers or Percentages.
Filtering the report
Filters are available on the Basic plan and higher.
- Click Filter (3).
- Open a filter group and set the conditions. For example, Period limits the dates, Show questions leaves only the questions you need, Filter by answers keeps respondents who chose a specific option. The number of selected filters is shown at the bottom of the panel.
- Click Apply.
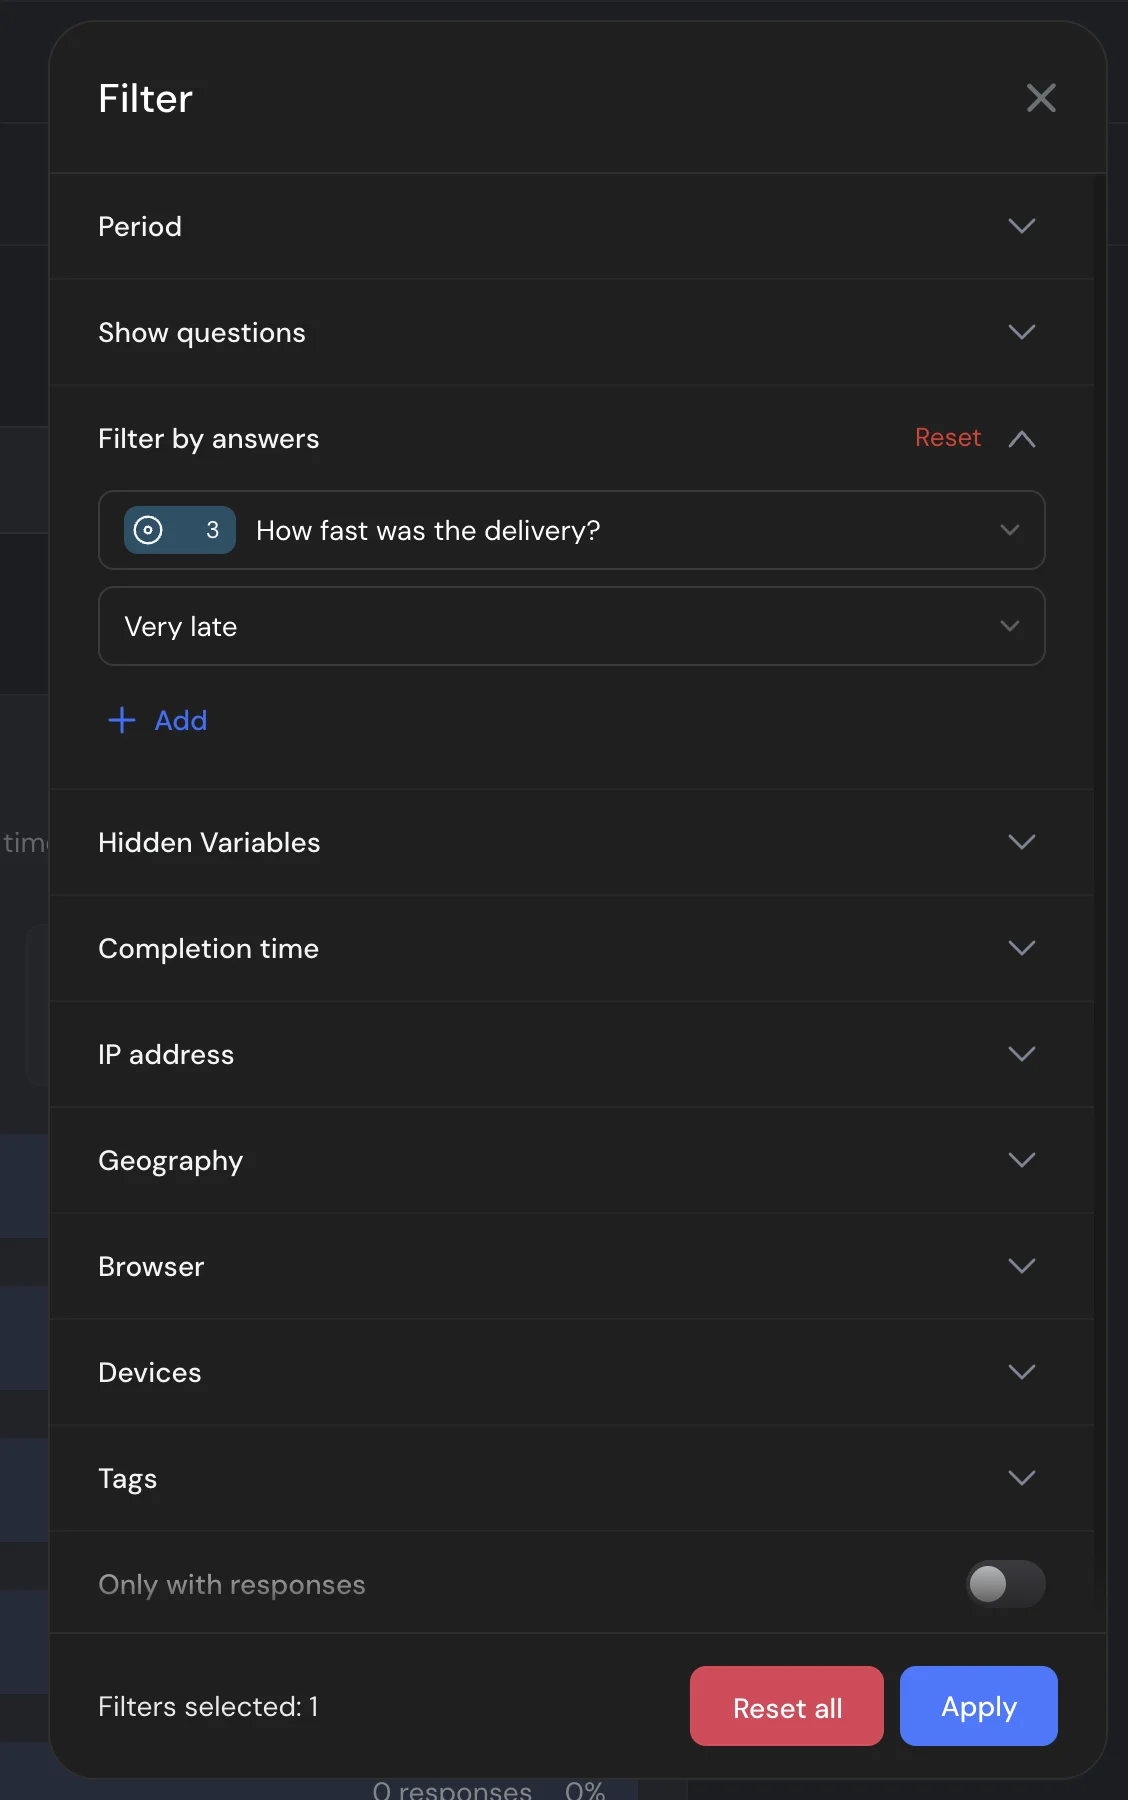
If you close the panel without clicking Apply, SurveyNinja asks what to do with the selected filters: Apply filters or Reset and close.
Applied filters appear above the report. Remove one by its cross, or remove all with Reset on the same bar. Reset all in the filter panel only clears the selection: click Apply after it.
Filters are saved with the survey. They stay applied when you come back, and your teammates see the report with the same filters.
Some filter groups appear only when the survey uses the matching feature: Score, Correct / Incorrect, Hidden Variables, Tags, Categories, A/B test, Unique links.
Changing chart colors
Click the Design icon in the toolbar. Under Where colors come from, choose Custom colors for this survey or Shared account palette (one palette for all your surveys). Pick a color preset or set your own colors, then click Save. The colors apply to the report, the summary, their public links and PDF files. Scales, ratings and NPS keep their own colors: there the color shows the score.
Downloading the report
- Click the Download icon (4).
- Choose PDF or DOC.
- Click Download.
The file shows the report with the applied filters and the selected status tab. On the Summary tab, the download is available as PDF.
To give someone access to the report without inviting them to your account, use the Share icon. See How to Share Results.
Note. If you edited a question after it received responses, the report keeps the responses to the earlier version separately. See Old Responses and Question Versions.