 25 Questions for a Travel Agency Customer Satisfaction Survey
How to Run a Product-Market Fit Survey and Read the 40% Line
Useful  Mike Taylor Sep 30, 2026 Reading time ≈ 13 min

The product-market fit survey rests on one question: how would you feel if you could no longer use the product? When at least 40% of active users answer "very disappointed", the product has usually found its market. Below that line, the other answers tell you who to build for and what to fix.
Product-market fit itself, the state where a product satisfies a real market, is defined in our glossary entry on PMF. This guide is about measuring it: the questions to ask, who belongs in the sample, how many answers you need, and what to do with the result.
Where the 40% line comes from
The test comes from Sean Ellis, who ran early growth at Dropbox and LogMeIn. He asked users of many startups the same question and compared the answers with how those companies grew. Products where at least 40% of users would be very disappointed without them tended to grow with far less effort. Products below the line tended to struggle for traction.
The number is a benchmark, not a law of nature. It works because it measures intensity rather than satisfaction. Plenty of people like a product they would drop tomorrow for a cheaper one. Only the ones who would be very disappointed show that it has become part of how they work, and that is what makes growth cheaper: those users stay, and they tell others.
That also makes it different from NPS. Our guide to Net Promoter Score covers the recommendation question, which tracks loyalty over time. The Ellis question asks something earlier and harder: would anyone miss you?
The four questions
The version Superhuman made famous has four questions. The first gives the score, the other three tell you what to do with it.
| Question | Format | What it tells you |
|---|---|---|
| How would you feel if you could no longer use [product]? | Very disappointed, somewhat disappointed, not disappointed | The score: the share of "very disappointed" |
| What type of people do you think would most benefit from [product]? | Open text | How your fans describe your ideal customer, in their words |
| What is the main benefit you receive from [product]? | Open text | What the product is actually for, as opposed to what the landing page says |
| How can we improve [product] for you? | Open text | What holds back the users who are almost convinced |
Keep the first question word for word. Rephrasing it as "How satisfied are you?" or adding a neutral option turns it into a different measurement, and the 40% benchmark no longer applies. The three open questions are where the work starts. Group the answers into themes before counting anything; our guide to thematic analysis shows how to code free text without drowning in it.
Who to survey
The score is only as good as the sample. Ellis recommended asking people who have experienced the core value of the product, have used it at least twice and have used it in the last two weeks. Superhuman applied the same filter.
Each part removes a distortion. Someone who signed up yesterday has not seen what the product does, so "not disappointed" from them means nothing. Someone who left three months ago answers about a product that no longer exists for them. Leave out your own team, investors and friendly beta testers as well: they inflate the score.
How you invite people matters almost as much as whom you invite. Keep the message short and neutral: you are improving the product, and the survey takes two minutes. Do not hint at the answer you hope for. Skip incentives bigger than a thank-you, too. A gift card brings answers from people who want the gift card, and they are exactly the users whose "very disappointed" means nothing.
The opposite mistake is just as common: surveying only your most engaged accounts. A sample of power users will clear 40% for almost any product. Take everyone who meets the three criteria, not only the ones you like talking to. Attach the user's plan, role and signup date to each answer from the start, because the real analysis happens by segment.
When to run it, and when not to
Run the survey once enough people have used the product for real. Before launch, or in the first weeks after it, most users have not reached the core value yet, and the score mostly measures onboarding. A useful moment is when you have at least a few dozen users who meet the three criteria above.
If you have fewer than that, do not wait for statistics. Ask the same four questions in interviews. Twenty conversations built on "How would you feel if you could no longer use it?" will tell you more than a survey with twelve answers, and the wording stays comparable for later.
In B2B products, the person who uses the product and the person who pays for it are often different. The survey goes to active users, but tag each answer with the account and the user's role. A score of 50% among daily users and 15% among the managers who sign the renewal is a warning, not a success.
How many answers you need
Rahul Vohra, the founder of Superhuman, wrote that results become directionally correct at around 40 respondents. Directionally is the key word. The score is a proportion, and a proportion from a small sample comes with a wide margin of error.
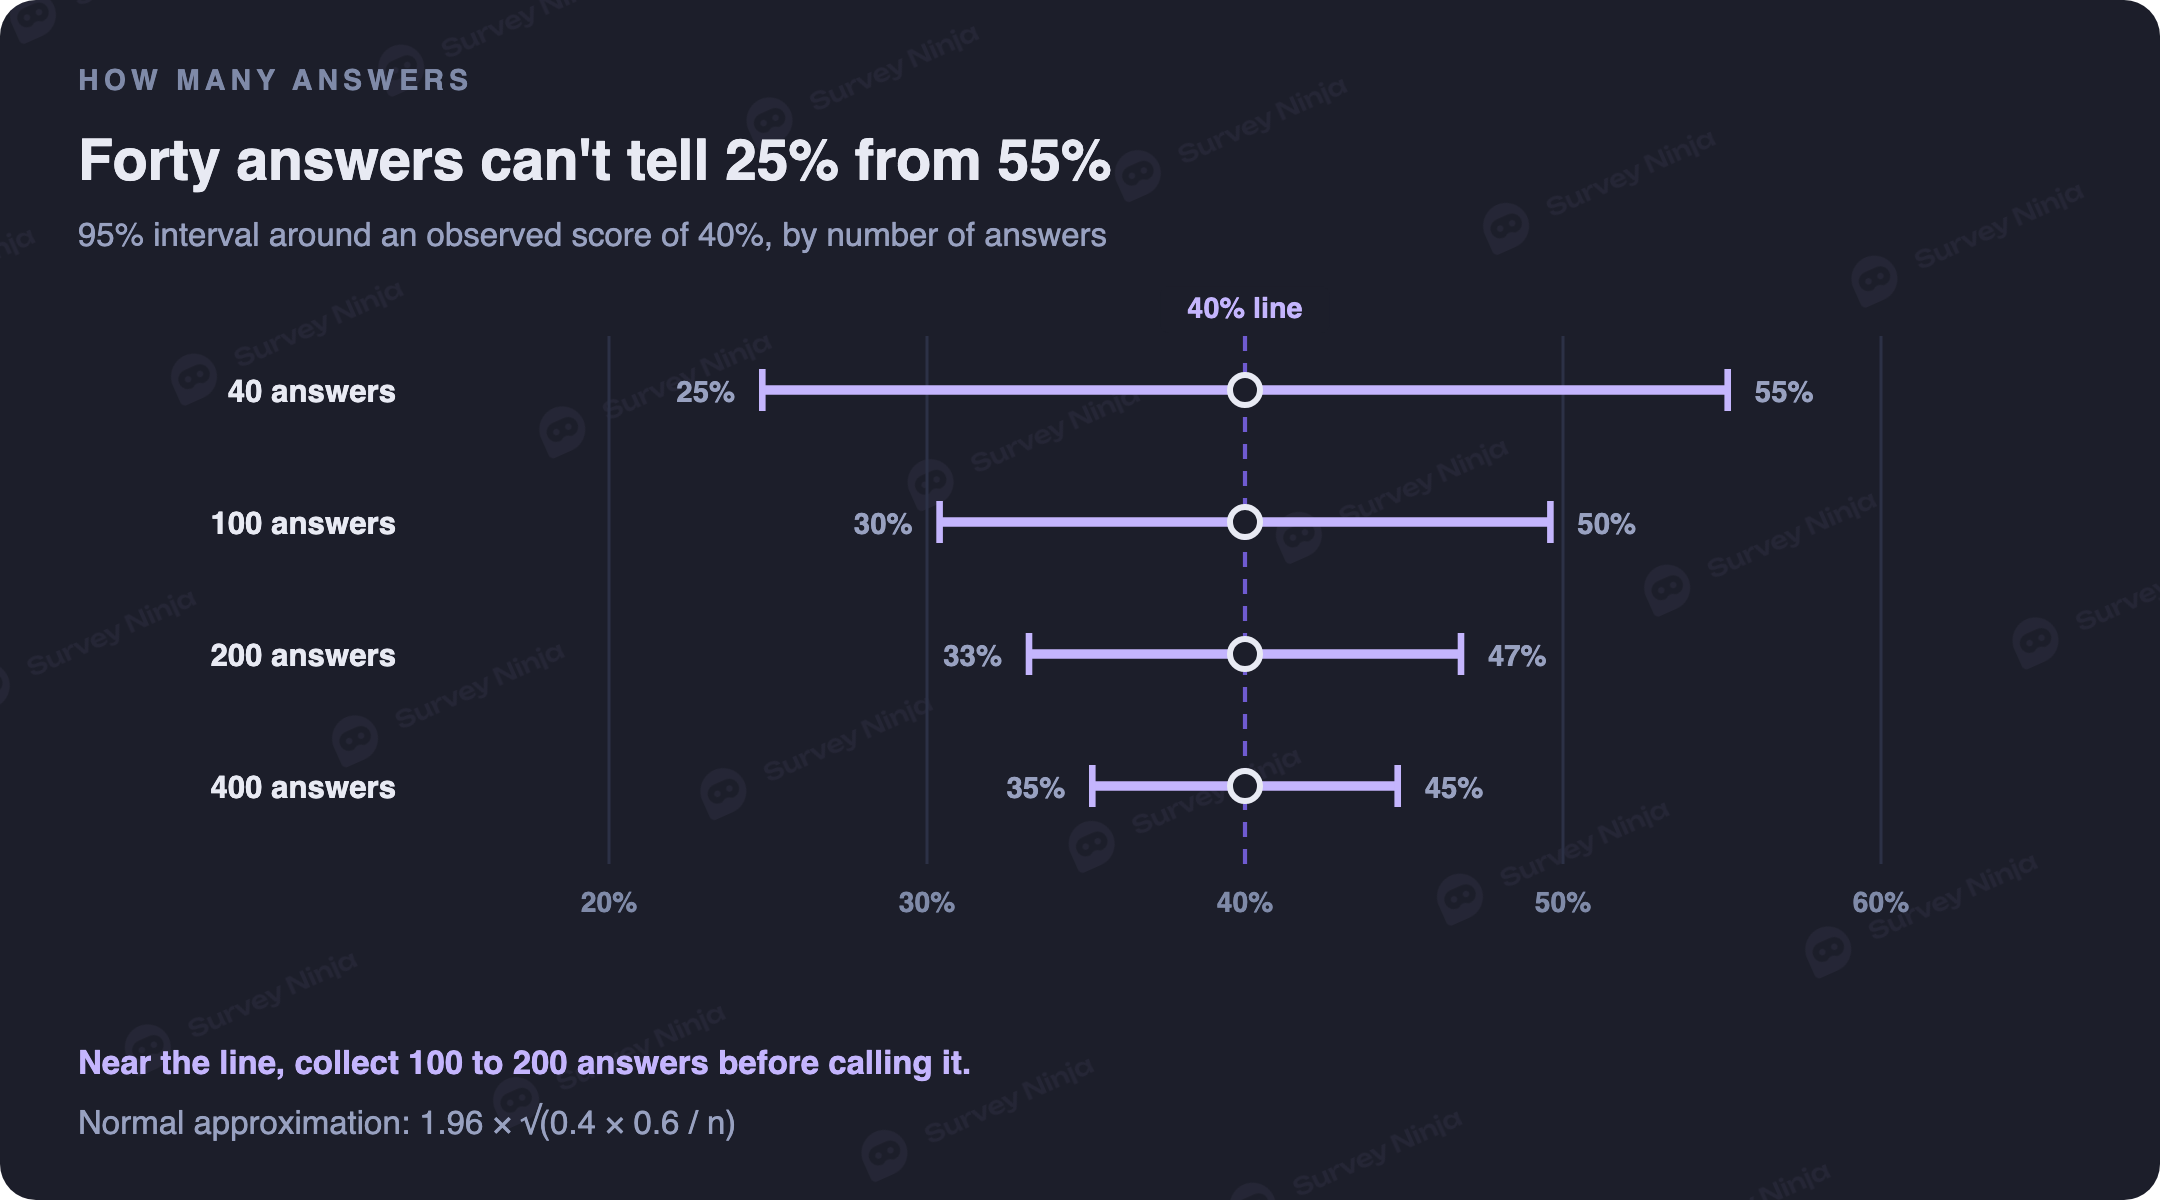
With 40 answers and a score of 40%, the true share could plausibly sit anywhere from 25% to 55%. That is enough to tell 15% from 60%, which is what an early startup needs. It is not enough to tell 36% from 44%, which is exactly the question once you are close to the line. Near the line, collect 100 to 200 answers before you call it. Our margin of error calculator gives the interval for any sample size.
How to read the answers
Start with the share of "very disappointed" across everyone who qualified. Then split it by segment: plan, role, company size, use case. The overall number is an average of very different groups, and the group that matters can be hidden inside it.
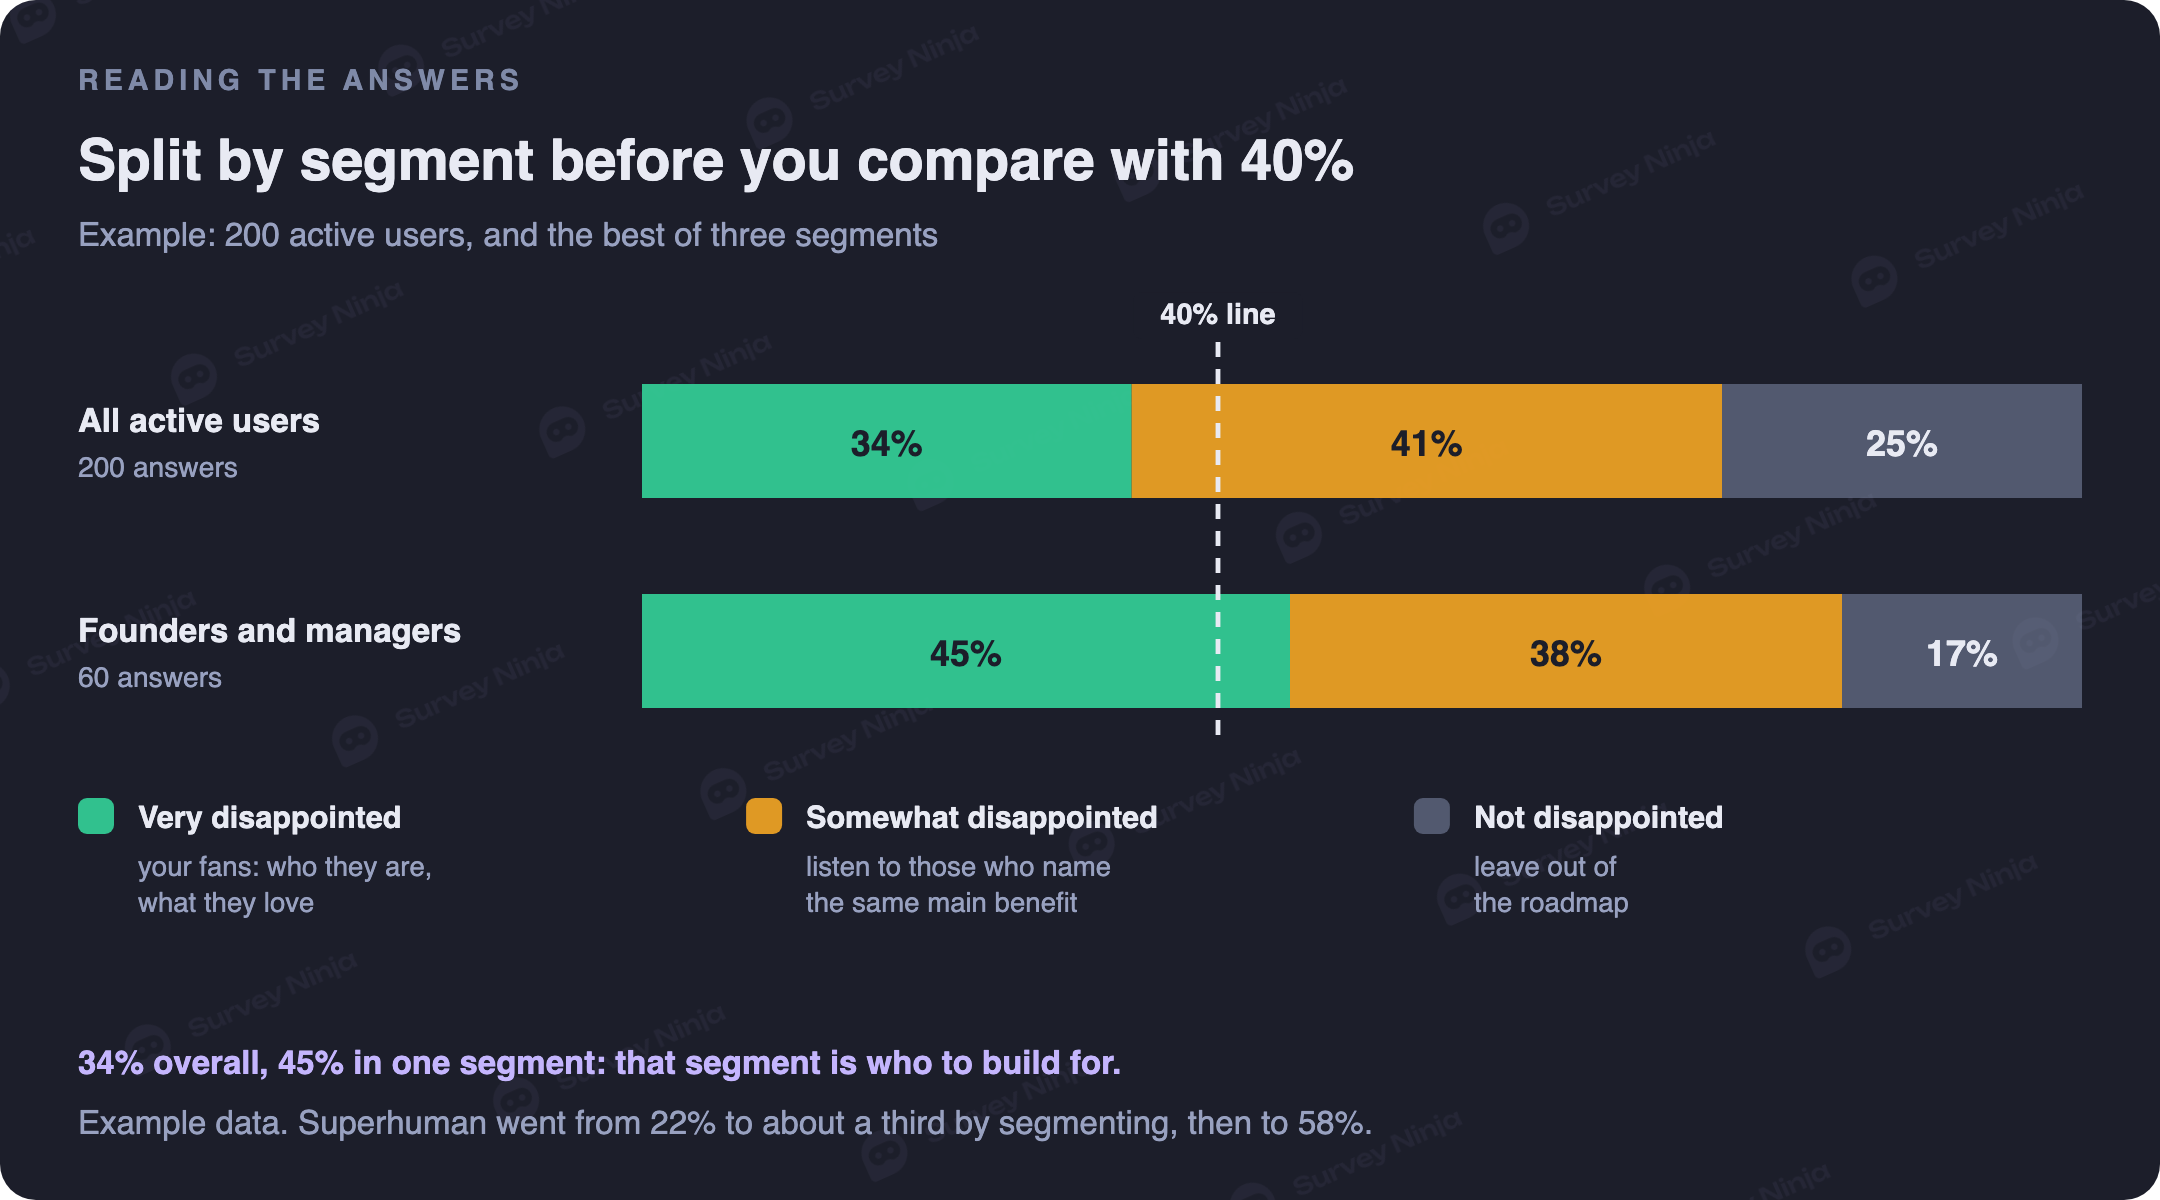
Here are the numbers behind the example, split the way a real analysis would be:
| Segment | Answers | Very disappointed | Score |
|---|---|---|---|
| Founders and managers | 60 | 27 | 45% |
| Individual contributors | 90 | 27 | 30% |
| Freelancers and students | 50 | 14 | 28% |
| All active users | 200 | 68 | 34% |
The overall 34% says "not there yet". The split says something more useful: the product already works for one group, and the other two are dragging the average down. The 60 answers in the best segment still carry a margin of about 13 points, so treat 45% as a strong lead to confirm, not a verdict.
Each answer group then has its own job. Very disappointed users are your fans: their answers to "who would benefit most" describe the customer to build for, and their main benefit tells you what to protect. Somewhat disappointed users are the growth reserve, but only those who name the same main benefit as your fans. For them the product almost works, and something specific holds them back. Not disappointed users go out of the roadmap entirely. Vohra's advice was to disregard them politely: building for people who would not miss you pulls the product away from the ones who would.
The Superhuman engine: segment, then build
Superhuman, an email app, ran the survey early on and got 22% "very disappointed", well below the line. The team then looked for the segment with the highest score. Founders, managers, executives and business development people stood out, and counting only them raised the score by about ten points, to roughly a third. Nothing in the product had changed yet. They had found out who it was for.
Then they split the roadmap in half. One half doubled down on what the fans loved, which for Superhuman was speed. The other half went to what held back the somewhat disappointed users for whom speed was also the main benefit. They kept surveying new users and tracked the score weekly, monthly and quarterly. Within three quarters it reached 58%.
The method is simple enough to copy. Find the segment with the highest score. Read what its fans love. Among the almost-convinced users who value the same thing, find what holds them back. Split the work between the two lists, then survey again with the same question.
Check the score against behavior
The survey measures what people say they would feel. Behavior shows what they do, and the two should agree. The clearest behavioral signal is the retention curve: the share of a signup cohort still active after one, two, three months. Without product-market fit the curve keeps sliding toward zero. With it, the curve flattens at some level and stays there.
Look at two more things alongside it. How many new users arrive through word of mouth rather than paid channels, and how often active users come back without reminders. If the survey says 45% but the retention curve for that same segment never flattens, trust the curve and look at who answered the survey. If both point the same way, you have a result you can plan around.
Common mistakes with the product-market fit survey
- Surveying everyone who ever signed up, including people who never reached the core of the product.
- Surveying only power users, which inflates the score.
- Rewording the first question or adding a neutral option.
- Reading the overall score and never splitting it by segment.
- Declaring victory on 40 answers when the score sits between 35% and 45%.
- Building for "not disappointed" users because they are the loudest in feedback.
- Running the survey once. The score is useful as a trend, measured the same way each time.
How to run the survey in SurveyNinja
The survey is short enough to build in a few minutes. You can create it for free or draft the questions with the AI product feedback question generator, then keep the first question exactly as written. Pass the user's plan, role and signup date as hidden variables in the survey link, so every answer arrives already tagged by segment and a crosstab gives you the score per group.
Reach users where they are active. Our guides cover in-app feedback for asking inside the product, triggered surveys for asking after a user has used the core feature twice, and email surveys for everyone else. For more ways surveys help a product team, from discovery to prioritization, see why product managers need surveys, and our pages for SaaS teams and product managers.
Frequently asked questions
What is a product-market fit survey?
It is a short survey of active users built around one question: how would you feel if you could no longer use the product? The share who answer "very disappointed" is used as a leading indicator of product-market fit.
What is the Sean Ellis test?
It is the same survey, named after Sean Ellis, who proposed it. Products where at least 40% of qualified users say they would be very disappointed without them tend to grow more easily than products below that line.
What percentage means product-market fit?
The usual benchmark is 40% "very disappointed" among users who have experienced the core value of the product. It is a rule of thumb, so treat results close to 40% with care and check them by segment.
How many responses do you need for a PMF survey?
Around 40 answers give a directional result. With 40 answers, a 40% score has a margin of error of about 15 points either way, so collect 100 to 200 answers when the result is close to the line.
Who should take the product-market fit survey?
Users who have experienced the core value of the product, have used it at least twice and have used it in the last two weeks. Leave out new signups, long-gone users, your team and friendly testers.
How often should you run the PMF survey?
Often enough to see a trend. Superhuman kept surveying new users and tracked the score weekly, monthly and quarterly. Always use the same question and the same sample rules, or the numbers will not compare.
Published: Sep 30, 2026