 25 Questions for a Travel Agency Customer Satisfaction Survey
How to Write the Respondents of the Study Section in Chapter 3
Useful  Mike Taylor Sep 29, 2026 Reading time ≈ 16 min

The respondents of the study section is usually two or three paragraphs long, and it has to answer four questions: who took part, how many, how they were chosen and how they were protected. Leave any of them vague and the panel will ask about it at your defense.
A respondent is the person who answers your questionnaire, and the term itself is covered in our glossary entry on respondents. This guide is about the part of Chapter 3 that describes them: what goes into it, how to justify the number, and what a finished version looks like.
What the respondents of the study section is
A common Chapter 3 runs in this order: research design, research locale, respondents of the study, research instrument, data gathering procedure and statistical treatment of data. The respondents section sits in the middle for a reason. The instrument is written for these people, the procedure explains how you reached them, and the statistics only make sense for the number you give here.
Schools use different headings for it. You will see Respondents of the Study, Participants of the Study, Subjects of the Study, Population and Sample, or a separate Sampling Procedure subsection. The content barely changes. The word does carry a signal, though: respondents answer a survey, while participants or informants take part in interviews, focus groups and experiments. For a qualitative study, "participants" is usually the better heading.
The six questions the section has to answer
Whatever your school calls it, a complete section answers six questions, roughly in this order:
- Who and where. The target population, defined tightly enough that an outsider could tell whether a given person belongs to it, and its location, unless the research locale section already gives it.
- Out of how many. The population size and the list it comes from.
- How many took part, and why that number. A formula, a calculator, total enumeration or data saturation.
- How they were chosen. The sampling technique, named correctly.
- Who was left out. Inclusion and exclusion criteria.
- How they were protected. Consent, confidentiality, the right to withdraw.
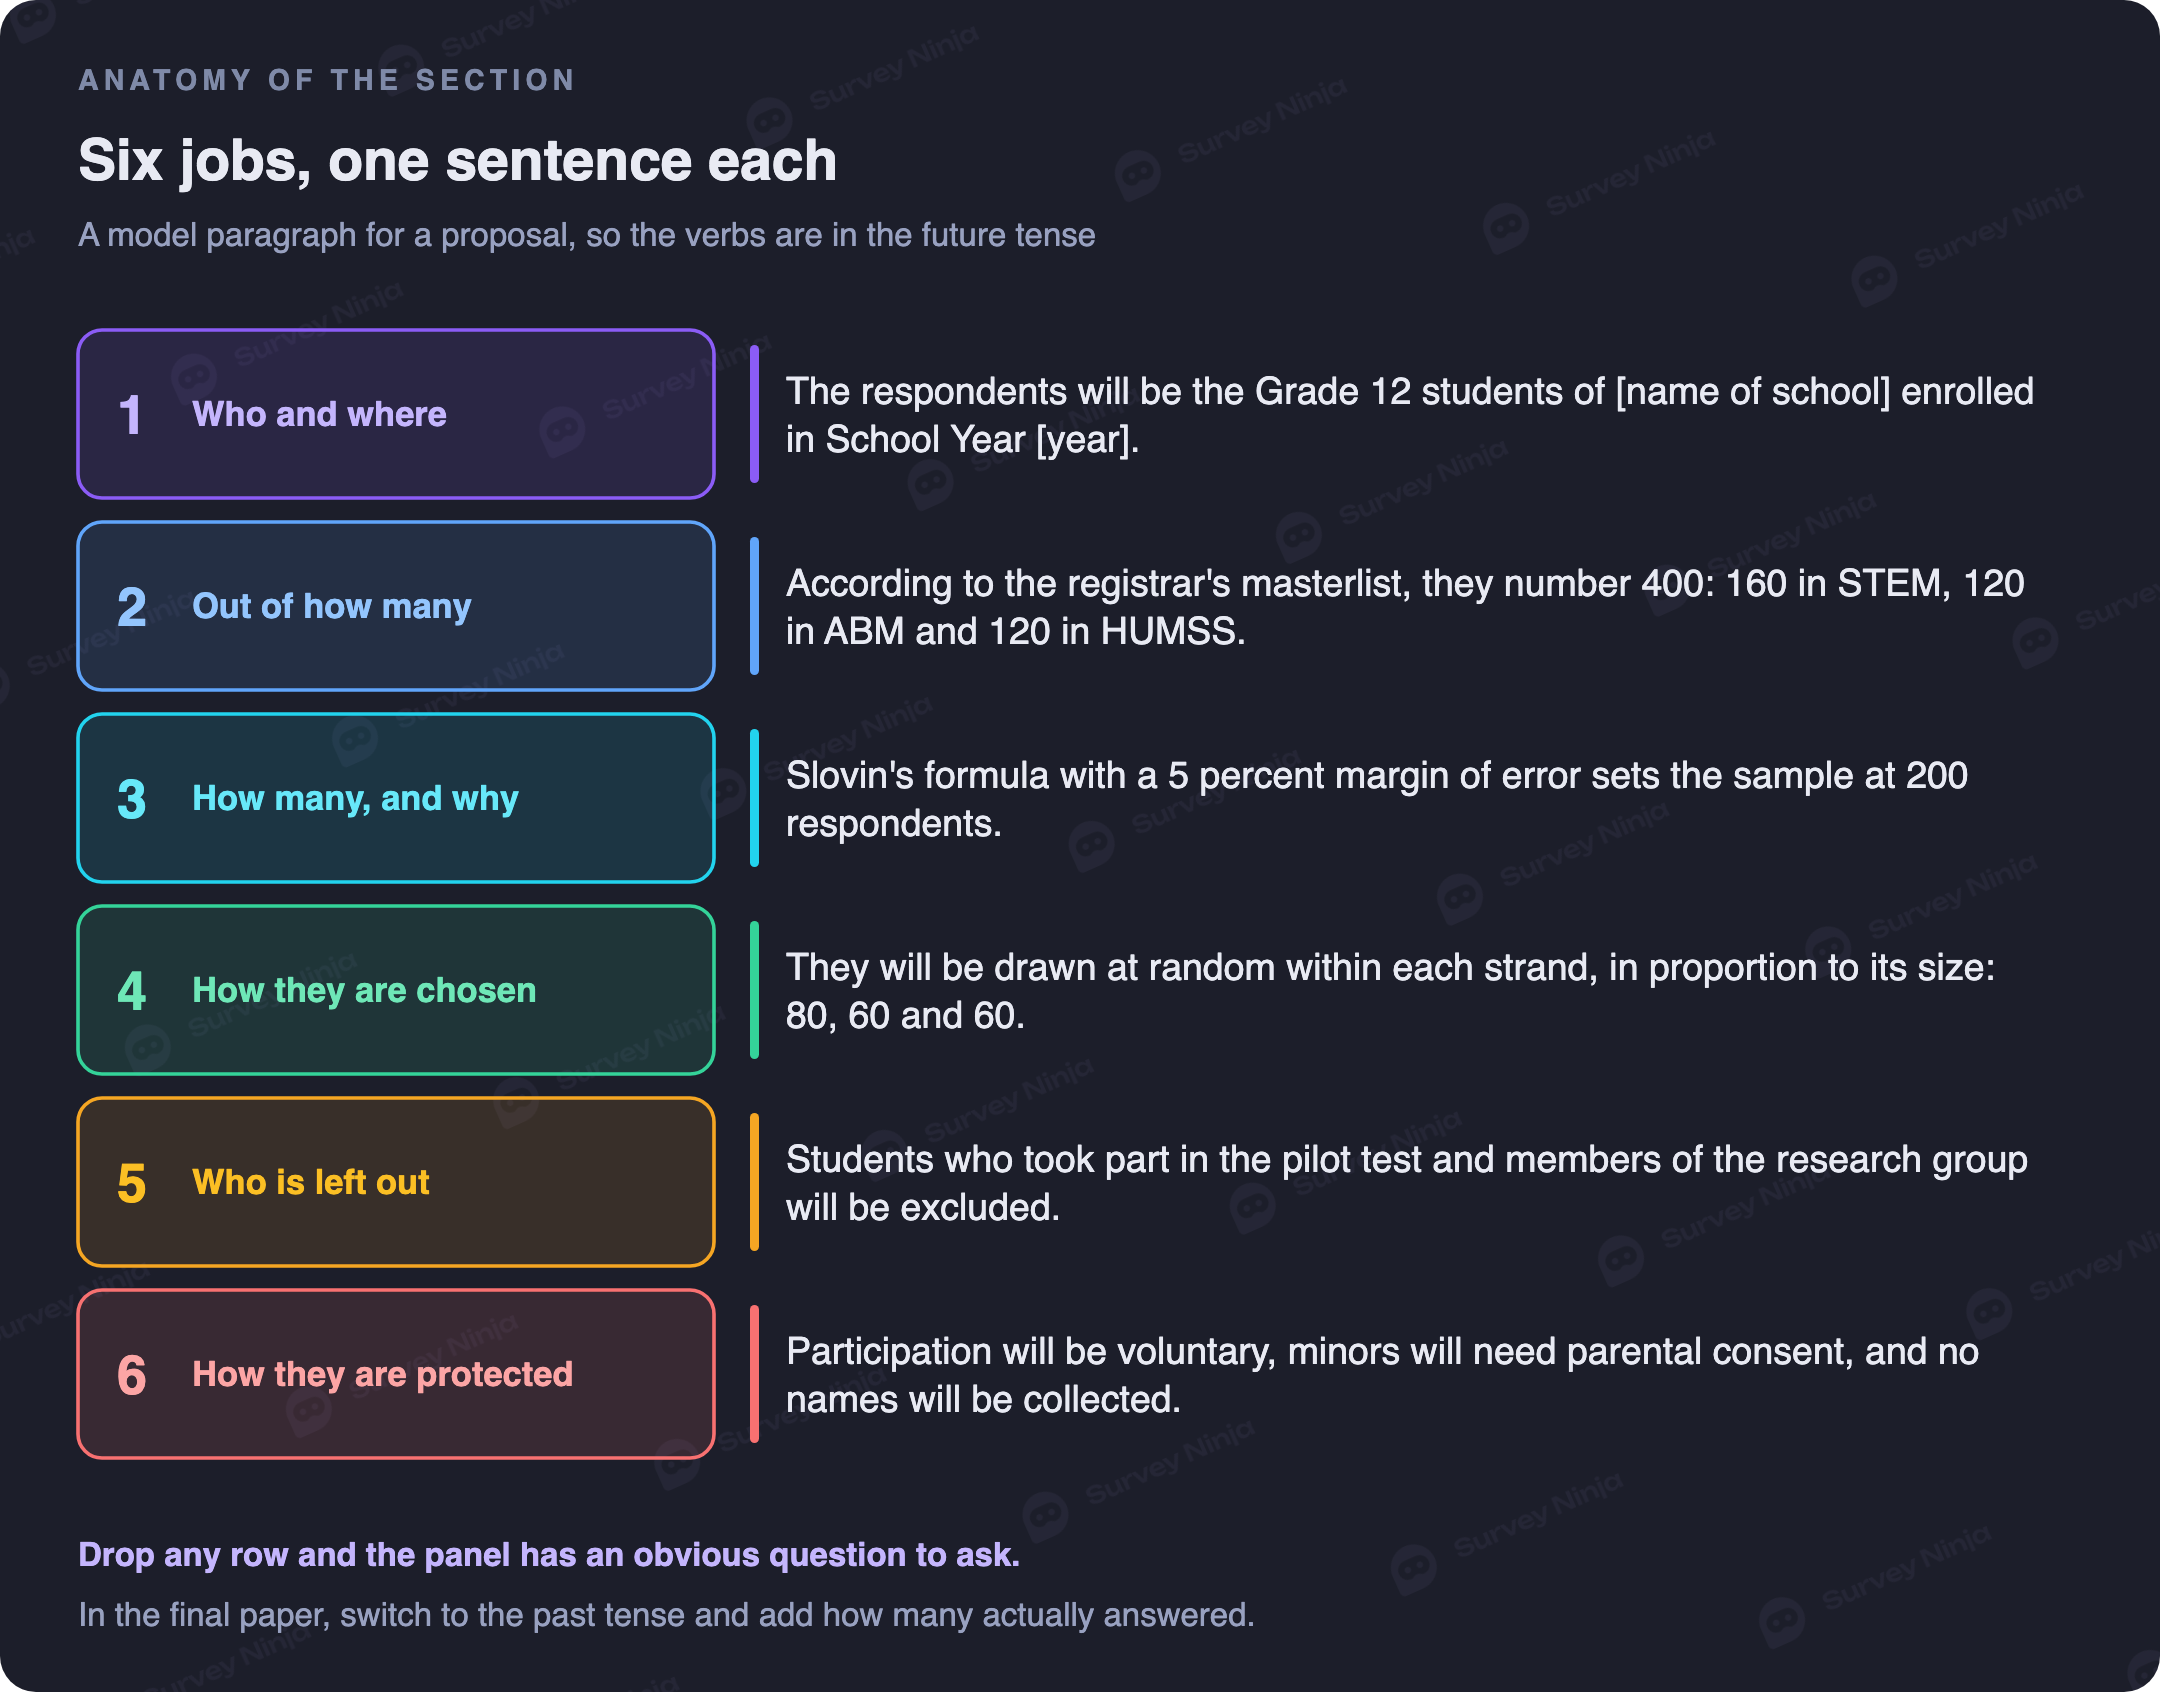
The diagram puts all six into one model paragraph. Each sentence does exactly one job.
Population, sample and sampling frame
Three terms get mixed up in this section, and the mix-up shows. The population is everyone your conclusions are about, for example all 400 Grade 12 students of one senior high school. The sampling frame is the actual list you draw from, such as the registrar's masterlist. The sample is the group that ends up answering, say 200 of those students.
Give all three when you have them. "The respondents are 200 Grade 12 students" leaves the obvious question open: 200 out of how many? The panel needs the population size to judge whether 200 is enough, and the frame tells them whether random selection was even possible. Some populations have no list at all, like online sellers in Cavite or freelance graphic designers. Say so plainly. It limits which sampling techniques you can honestly claim.
How many respondents: Slovin's formula
Many theses in the Philippines compute the sample size with Slovin's formula:
n = N / (1 + N × e²)
N is the population size and e is the margin of error you accept, written as a decimal. For 400 students and a 5 percent margin of error:
n = 400 / (1 + 400 × 0.05²) = 400 / (1 + 1) = 200
That gives 200 respondents. When the result has decimals, round up: 285.7 becomes 286, never 285. The same formula appears in Taro Yamane's 1967 statistics textbook, which is why some papers call it Yamane's formula.
Two choices are built into the formula: a 95 percent confidence level and the most cautious assumption about the answers, a 50/50 split. Tejada and Punzalan (2012), writing in The Philippine Statistician, show that it is appropriate only when you estimate a proportion, such as the share of students who agree with a statement, at that 95 percent level. When a panelist asks "at what confidence level?", this is the answer they are looking for.
What it cannot do matters more. Slovin's formula says nothing about comparing groups, testing a relationship or running a regression. If your statement of the problem asks whether male and female students differ, or whether study hours predict grades, the sample size should come from a power analysis, which free software such as G*Power runs in a few minutes. For a descriptive survey that reports percentages, Slovin is acceptable. Just state the margin of error and the confidence level behind it.
If you want to set the confidence level yourself, our sample size calculator uses Cochran's formula with a finite population correction. For the same 400 students at 95 percent and ±5 percent it returns 197. The gap to Slovin's 200 comes from a rounded constant: Slovin's formula effectively uses z = 2, and the calculator uses the exact 1.96. Either figure is defensible, as long as you name the method.
Why a bigger population barely changes the sample
Ten times the population does not mean ten times the respondents. At a 5 percent margin of error, 1,000 students need 286 respondents by Slovin's formula, and 10,000 students need 385. Past a few thousand the sample hardly grows. At this margin it never exceeds 400, because 1 / 0.05² = 400 is the ceiling.
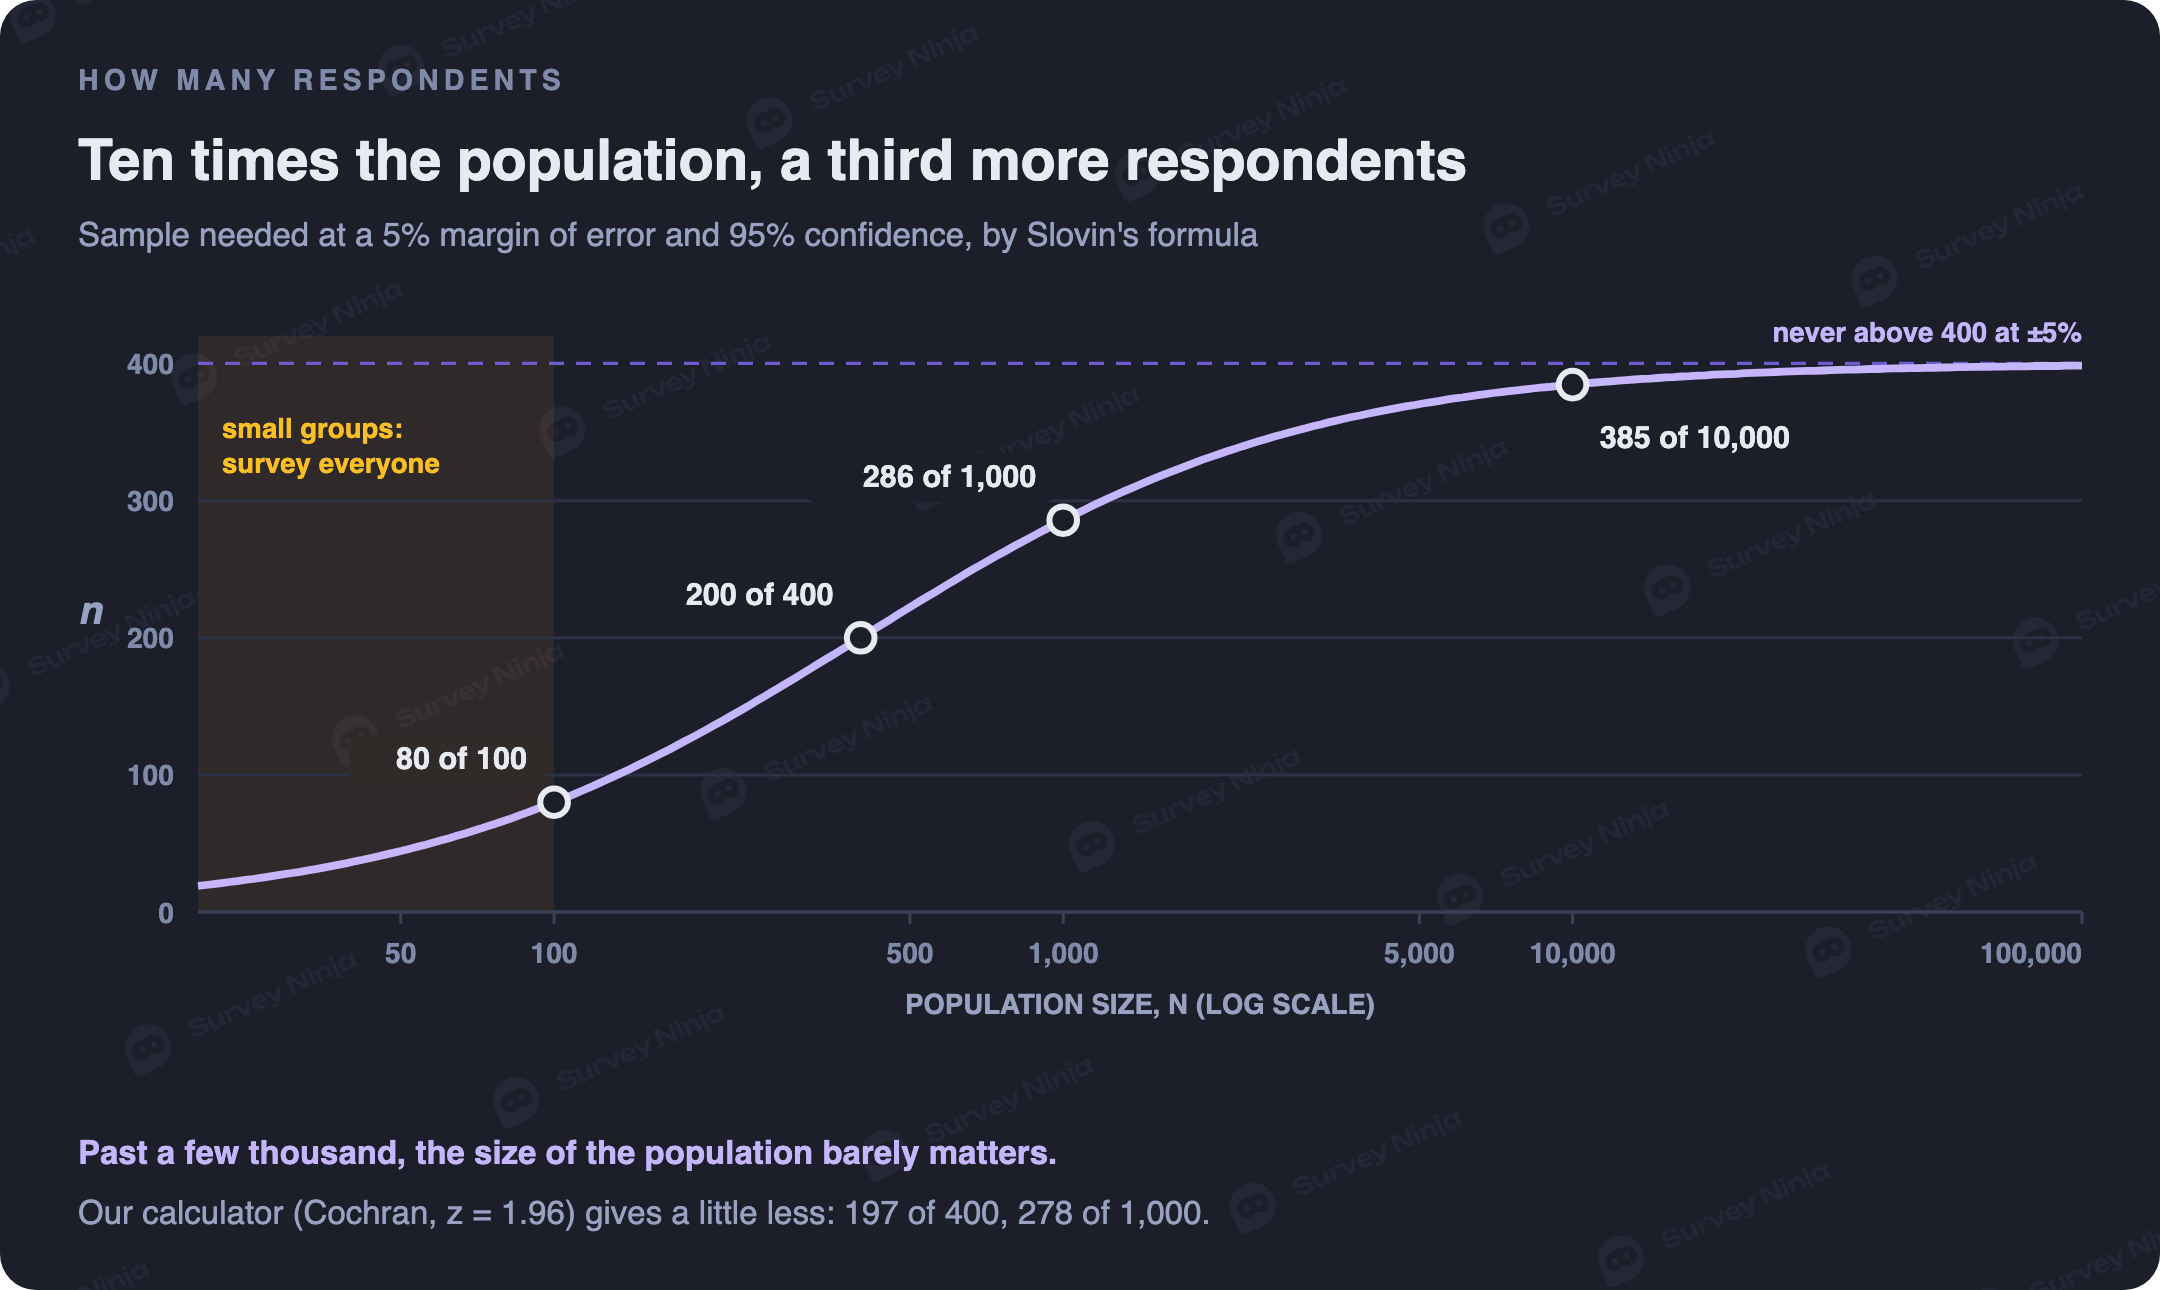
For small studies the other end of the curve matters more. A population of 100 needs 80 respondents, most of the group. A population of 50 needs 45. At that point it is simpler and stronger to survey everyone. This is called total enumeration: you include the whole population and say that you did, rather than forcing a formula onto it.
Keep in mind that the formula gives the number of completed responses, not the number of people you invite. If you expect four in ten students to answer an online form, 200 responses means sending the link to about 500. Our invites needed calculator does this arithmetic, and the expected response rate is worth one sentence in the section.
How many participants in a qualitative study
Formulas do not apply to interviews and focus groups. The usual justification is data saturation: you keep interviewing until new interviews stop producing new themes. In a well-known experiment, Guest, Bunce and Johnson (2006) found that saturation came at about twelve interviews in a fairly homogeneous group. That describes one study, not a quota. Use it as a reference point and explain how you will judge saturation in yours.
Qualitative participants are picked on purpose, so the technique is almost always purposive sampling, sometimes snowball. The criteria carry the weight here. Explain what makes someone informative for your question, for example "public elementary teachers with at least five years of experience handling multigrade classes." If you will code the transcripts into themes, our guide to thematic analysis covers that next step.
How to describe the sampling technique
Name the technique that describes what you actually did, not the one that sounds most rigorous. Posting a form link in a class group chat and taking whoever answers is convenience sampling, however random the respondents feel. Calling it simple random sampling is a mislabel that a panel uncovers with one question: how did you randomize?
Each technique below comes with a sentence to adapt, written in the past tense of a final paper.
| Technique | When it fits | A sentence you can adapt |
|---|---|---|
| Simple random | You have a complete list of the population | Two hundred students were drawn from the registrar's masterlist with a random number generator. |
| Systematic | A list, and you take every k-th name | Every second student on the alphabetical masterlist was selected, starting from a randomly chosen name. |
| Stratified, proportional | Subgroups that must appear in their real shares | The sample was allocated to the strands in proportion to enrollment: 80 from STEM, 60 from ABM and 60 from HUMSS. |
| Cluster | Natural groups, such as sections, instead of individuals | Four of the twelve Grade 12 sections were drawn at random, and every student in them was surveyed. |
| Purposive | Qualitative work that needs specific experience | Ten teachers were chosen because they had handled multigrade classes for at least five years. |
| Convenience | No list and limited access | The questionnaire was shared in the school's online groups, and every student who answered within two weeks was included. |
| Snowball | Hard-to-reach groups | The first five respondents were asked to refer others who met the criteria. |
The first four are probability techniques. They let you generalize to the population with a stated margin of error. The last three do not, which is acceptable for many student studies as long as the scope and limitations say so. Our article on probability sampling goes through each method with its strengths and weaknesses.
Inclusion and exclusion criteria
Criteria turn a loose population into one that can be checked. Inclusion criteria say who qualifies: "currently enrolled Grade 12 students who have used the school's learning management system for at least one semester." Exclusion criteria remove people who would qualify but should not be counted, such as transferees who arrived after the first quarter, members of the research group, or students who answered the pilot version of the questionnaire. The pilot is also where you test the instrument's reliability with Cronbach's alpha, so those students have already seen the questions.
Write criteria that a stranger could apply without asking you anything. "Students who are active online" cannot be checked. "Students who logged into the school LMS at least once a week in the past month" can.
Ethical considerations for respondents
Even if ethics has its own subsection, state the essentials here. Participation is voluntary. Respondents give informed consent after learning the purpose of the study, how long it takes and what happens to their answers. They can withdraw at any point without penalty, and their answers are reported only in aggregate.
Two cases need more care. Minors, and that includes many senior high school students, need written consent from a parent or guardian plus their own assent. In the Philippines, collecting names, contact details or other personal information also brings the study under the Data Privacy Act of 2012 (Republic Act No. 10173), so state what you collect, why, and how long you keep it. The simplest way to lighten that burden is to collect no identifiers at all. An anonymous survey has no name field to protect.
In an online questionnaire the consent statement belongs on the first screen, followed by a required "I agree" before the first question. You can build that in SurveyNinja for free, share the link, and export the answers to Excel for the statistical treatment. The free plan has no cap on responses, so the tool never limits your sample size.
A model respondents of the study section
Here is a complete example for a descriptive survey, as it would appear in a proposal, so the verbs are in the future tense. Replace the bracketed details and keep the order.
The respondents of this study will be the Grade 12 students of [name of school] enrolled in School Year [year]. According to the registrar's masterlist, the population consists of 400 students: 160 in the STEM strand, 120 in ABM and 120 in HUMSS. Using Slovin's formula with a 5 percent margin of error, the required sample is 200 respondents. The sample will be allocated to the three strands in proportion to their enrollment, giving 80 STEM, 60 ABM and 60 HUMSS students, and respondents in each strand will be drawn from the masterlist with a random number generator.
Included will be students currently enrolled in Grade 12 who have used the school's learning management system for at least one semester. Students who took part in the pilot test and members of the research group will be excluded. Participation will be voluntary. Students under 18 will need signed parental consent and will give their own assent, and all respondents may withdraw at any time without penalty. No names will be collected, and results will be reported only in aggregate.
In the final paper the same paragraph moves to the past tense and reports what actually happened: "Of the 200 students selected, 188 returned complete questionnaires, a response rate of 94 percent." If the final number fell short of the plan, say by how much and why. A shortfall you explain is far easier to defend than one the panel finds on its own.
The profile of respondents belongs in Chapter 4
The demographic profile reports data you collected, so it goes with the results, usually as the first table of Chapter 4. Chapter 3 says whom you planned to survey, Chapter 4 shows who answered. The standard format is frequency and percentage:
| Profile | Frequency | Percentage |
|---|---|---|
| Sex: female | 108 | 57.4 |
| Sex: male | 80 | 42.6 |
| Strand: STEM | 76 | 40.4 |
| Strand: ABM | 56 | 29.8 |
| Strand: HUMSS | 56 | 29.8 |
| Total, for each variable | 188 | 100.0 |
Check the realized shares against the plan. STEM is 40.4 percent of respondents and 40 percent of the population, so the stratification held. If a group had answered far less than planned, you would say so here and explain the effect in the limitations.
Common mistakes in the respondents section
- A sample size with no population, or a population with no source for the number.
- Convenience sampling described as random.
- Slovin's formula used for a study that compares groups or tests relationships.
- The number of invitations reported as the number of respondents.
- Criteria nobody else could apply, such as "active students" or "willing respondents."
- Future tense left over in the final paper.
- Respondents listed by name, or quoted in a way that identifies them.
From here the section feeds the rest of Chapter 3: the instrument, the data gathering procedure and the statistical treatment. For the survey itself, from choosing questions to cleaning the data before analysis, see our guide to surveys for thesis research.
Frequently asked questions
What is the respondents of the study in a research paper?
It is the part of the methodology, usually in Chapter 3, that describes who took part: the population, the number of respondents and how it was set, the sampling technique, the criteria for inclusion and exclusion, and how respondents were protected.
How do you make the respondents of the study section?
Describe the population and where it is, give the number of respondents and how you computed it, name the sampling technique, then state the criteria and the ethical safeguards. Use the future tense in a proposal and the past tense in the final paper.
What is the difference between respondents and participants?
Respondents answer a questionnaire or survey. Participants, or informants, take part in interviews, focus groups or experiments. Many schools accept either heading, but "participants" fits a qualitative study better.
How do you compute the number of respondents using Slovin's formula?
Use n = N / (1 + N × e²), where N is the population and e is the margin of error as a decimal. For 400 people at 5 percent, 400 / (1 + 400 × 0.0025) = 200. Round any decimals up.
What margin of error should I use?
Five percent is the usual choice. A 10 percent margin cuts the sample for a population of 400 from 200 to 80, but your percentages become much less precise. Check what your school or adviser expects.
What if the population is small?
If the formula asks for most of the population, survey everyone. This is total enumeration. It removes sampling error, though not the error from people who do not respond, so still report how many answered.
Published: Sep 29, 2026