 25 Questions for a Travel Agency Customer Satisfaction Survey
How to Write the Statistical Treatment of Data in Chapter 3
Useful  Mike Taylor Sep 30, 2026 Reading time ≈ 13 min

The statistical treatment of data tells the panel which tool answers each question in your statement of the problem. When the match is right, the section fits on half a page. When it is wrong, Chapter 4 rests on a test that cannot answer what you asked.
The section usually closes Chapter 3, after the respondents of the study, the research instrument and the data gathering procedure. This guide covers what goes into it, how the weighted mean and its interpretation scale are computed, which test fits which question, and what a finished version looks like.
What the statistical treatment of data section is
It is a list of the statistical tools you will use, with three facts about each: what it is, which question in your statement of the problem it answers, and how it is computed. Some schools call the section Data Analysis or Statistical Tools. The content is the same.
Two more things belong here. The level of significance, almost always 0.05, stated once for every test. And the software, whether Excel, SPSS or a free program such as jamovi. A proposal uses the future tense ("will be used"), the final paper the past tense.
The quickest way to build the section is to read your statement of the problem one question at a time. Every numbered question needs exactly one tool, and every tool you list needs a question. A tool with no question to answer is padding, and a panel may well ask why it is there.
Match each question to a tool
Research questions come in three kinds. Some ask you to describe something, such as the profile of the respondents or their level of agreement. Some ask you to compare groups, such as male and female students. Others ask whether two things are related, such as study hours and grades. The kind of question decides the tool. The type of data decides the variant.
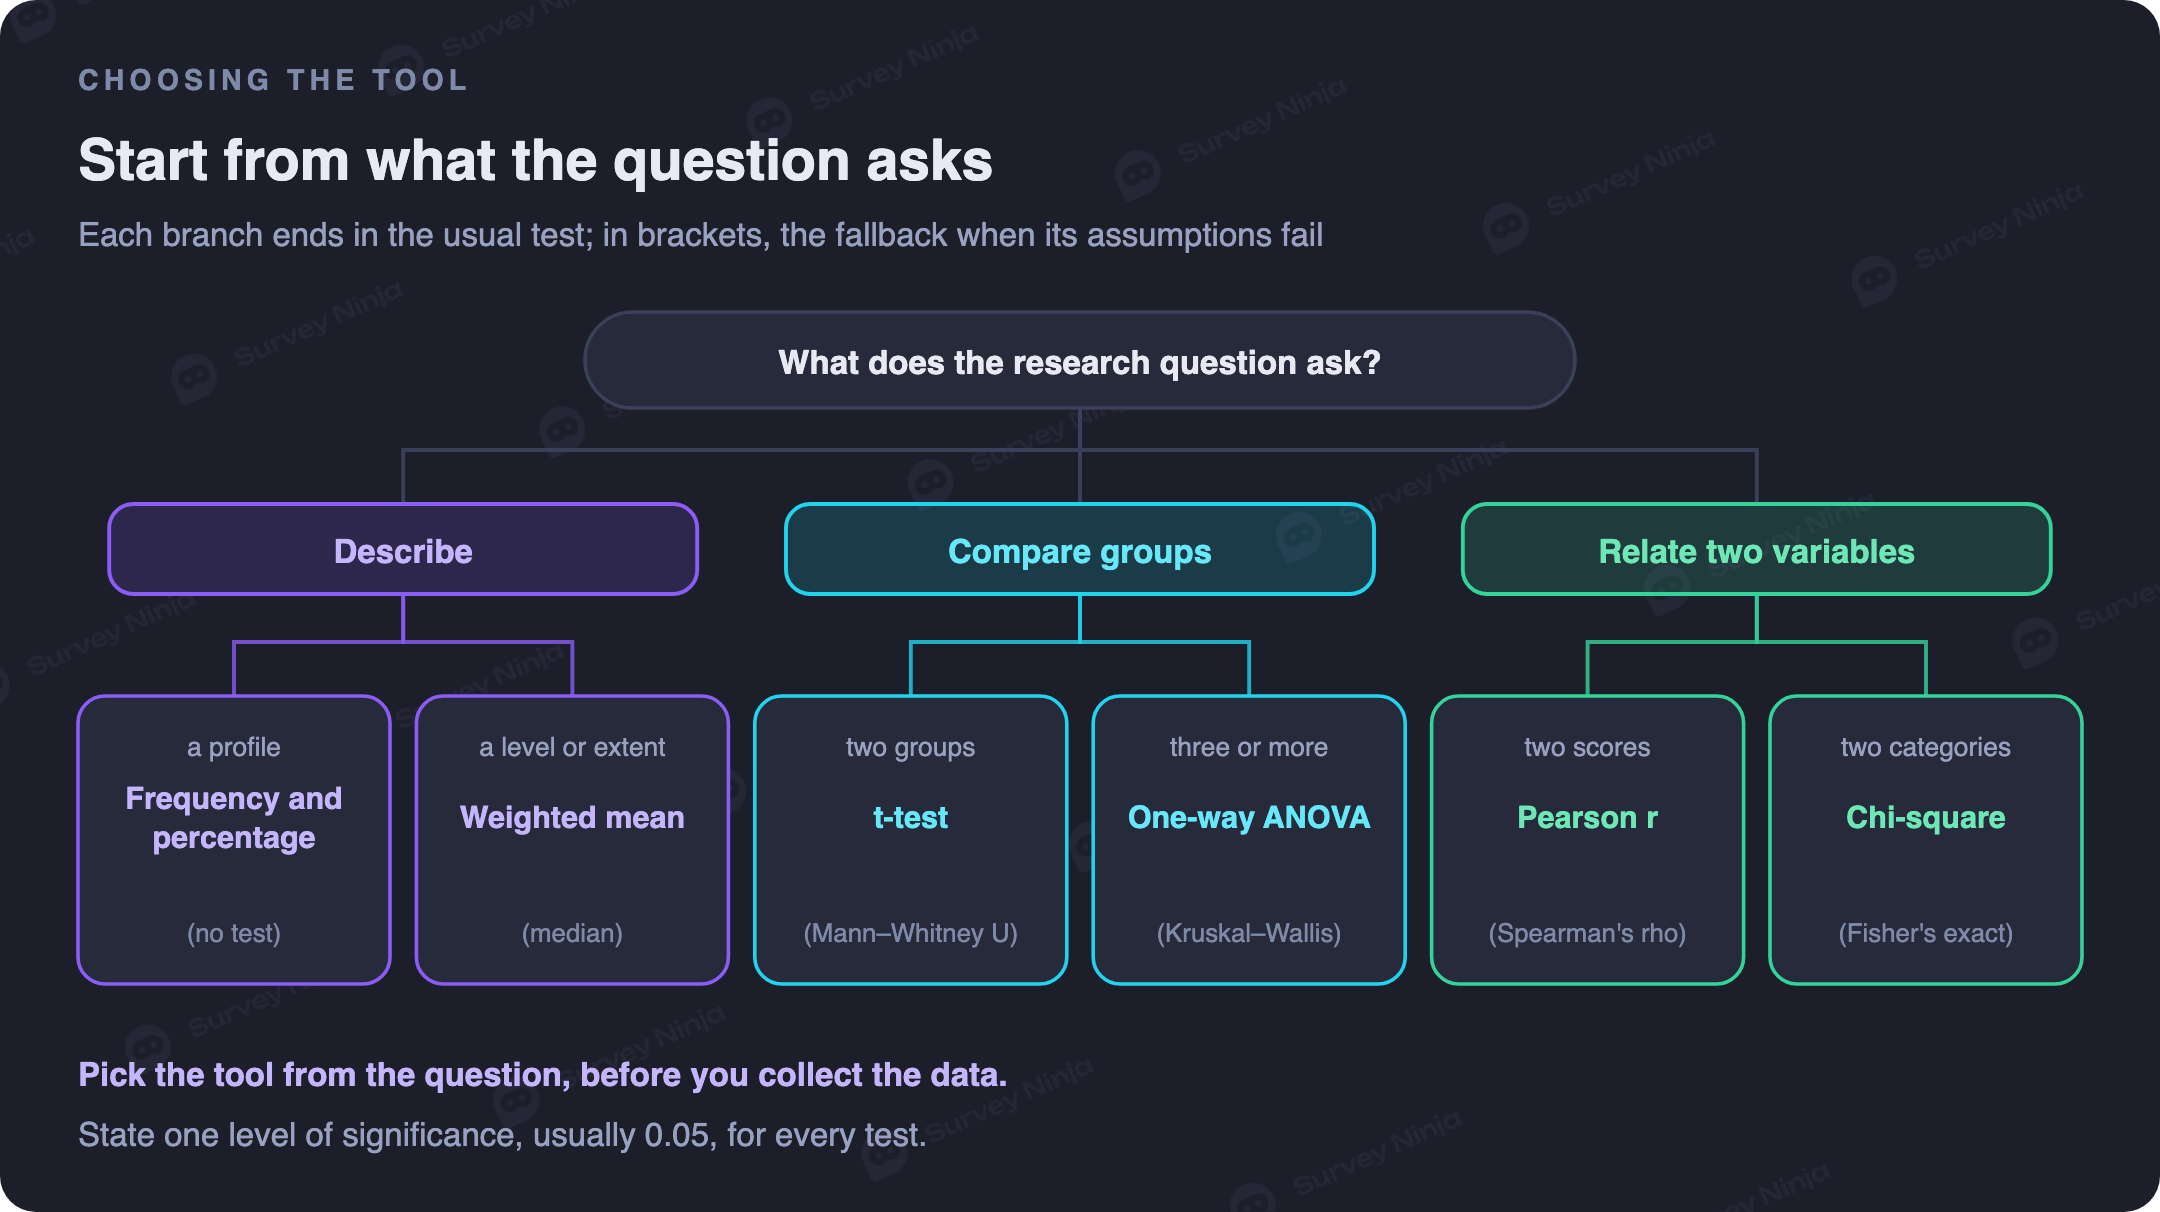
The same map as a table, with the fallback to use when a test's assumptions do not hold:
| The question asks | Example | Usual tool | If assumptions fail |
|---|---|---|---|
| A profile | What is the profile of the respondents in terms of sex and strand? | Frequency and percentage | Not needed |
| A level or extent | What is the respondents' level of agreement on online learning? | Weighted mean with an interpretation scale | Median |
| A difference, two groups | Is there a significant difference between male and female respondents? | Independent samples t-test | Mann–Whitney U test |
| A difference, three or more groups | Is there a significant difference among the STEM, ABM and HUMSS strands? | One-way ANOVA | Kruskal–Wallis test |
| A relationship, two scores | Is there a significant relationship between study hours and the level of agreement? | Pearson r | Spearman's rho |
| An association, two categories | Is the preferred learning mode associated with the strand? | Chi-square test of independence | Fisher's exact test, for small counts |
Frequency and percentage
The first question in most statements of the problem asks for the profile of the respondents, and the tool is the plainest one: count each category and turn the count into a share.
P = (f / n) × 100
Here f is the frequency of a category and n is the number of respondents. If 108 of 188 respondents are female, P = 108 / 188 × 100 = 57.4 percent. Round to one decimal place and check that each variable adds up to 100.0. The profile table itself goes in Chapter 4, with the results.
Weighted mean and the Likert interpretation scale
For questions about a level or an extent measured on a Likert scale, theses in the Philippines use the weighted mean. Each answer carries a weight, from 5 for strongly agree down to 1 for strongly disagree, and the mean is the sum of frequency times weight divided by the number of respondents:
WM = Σ(f × w) / n
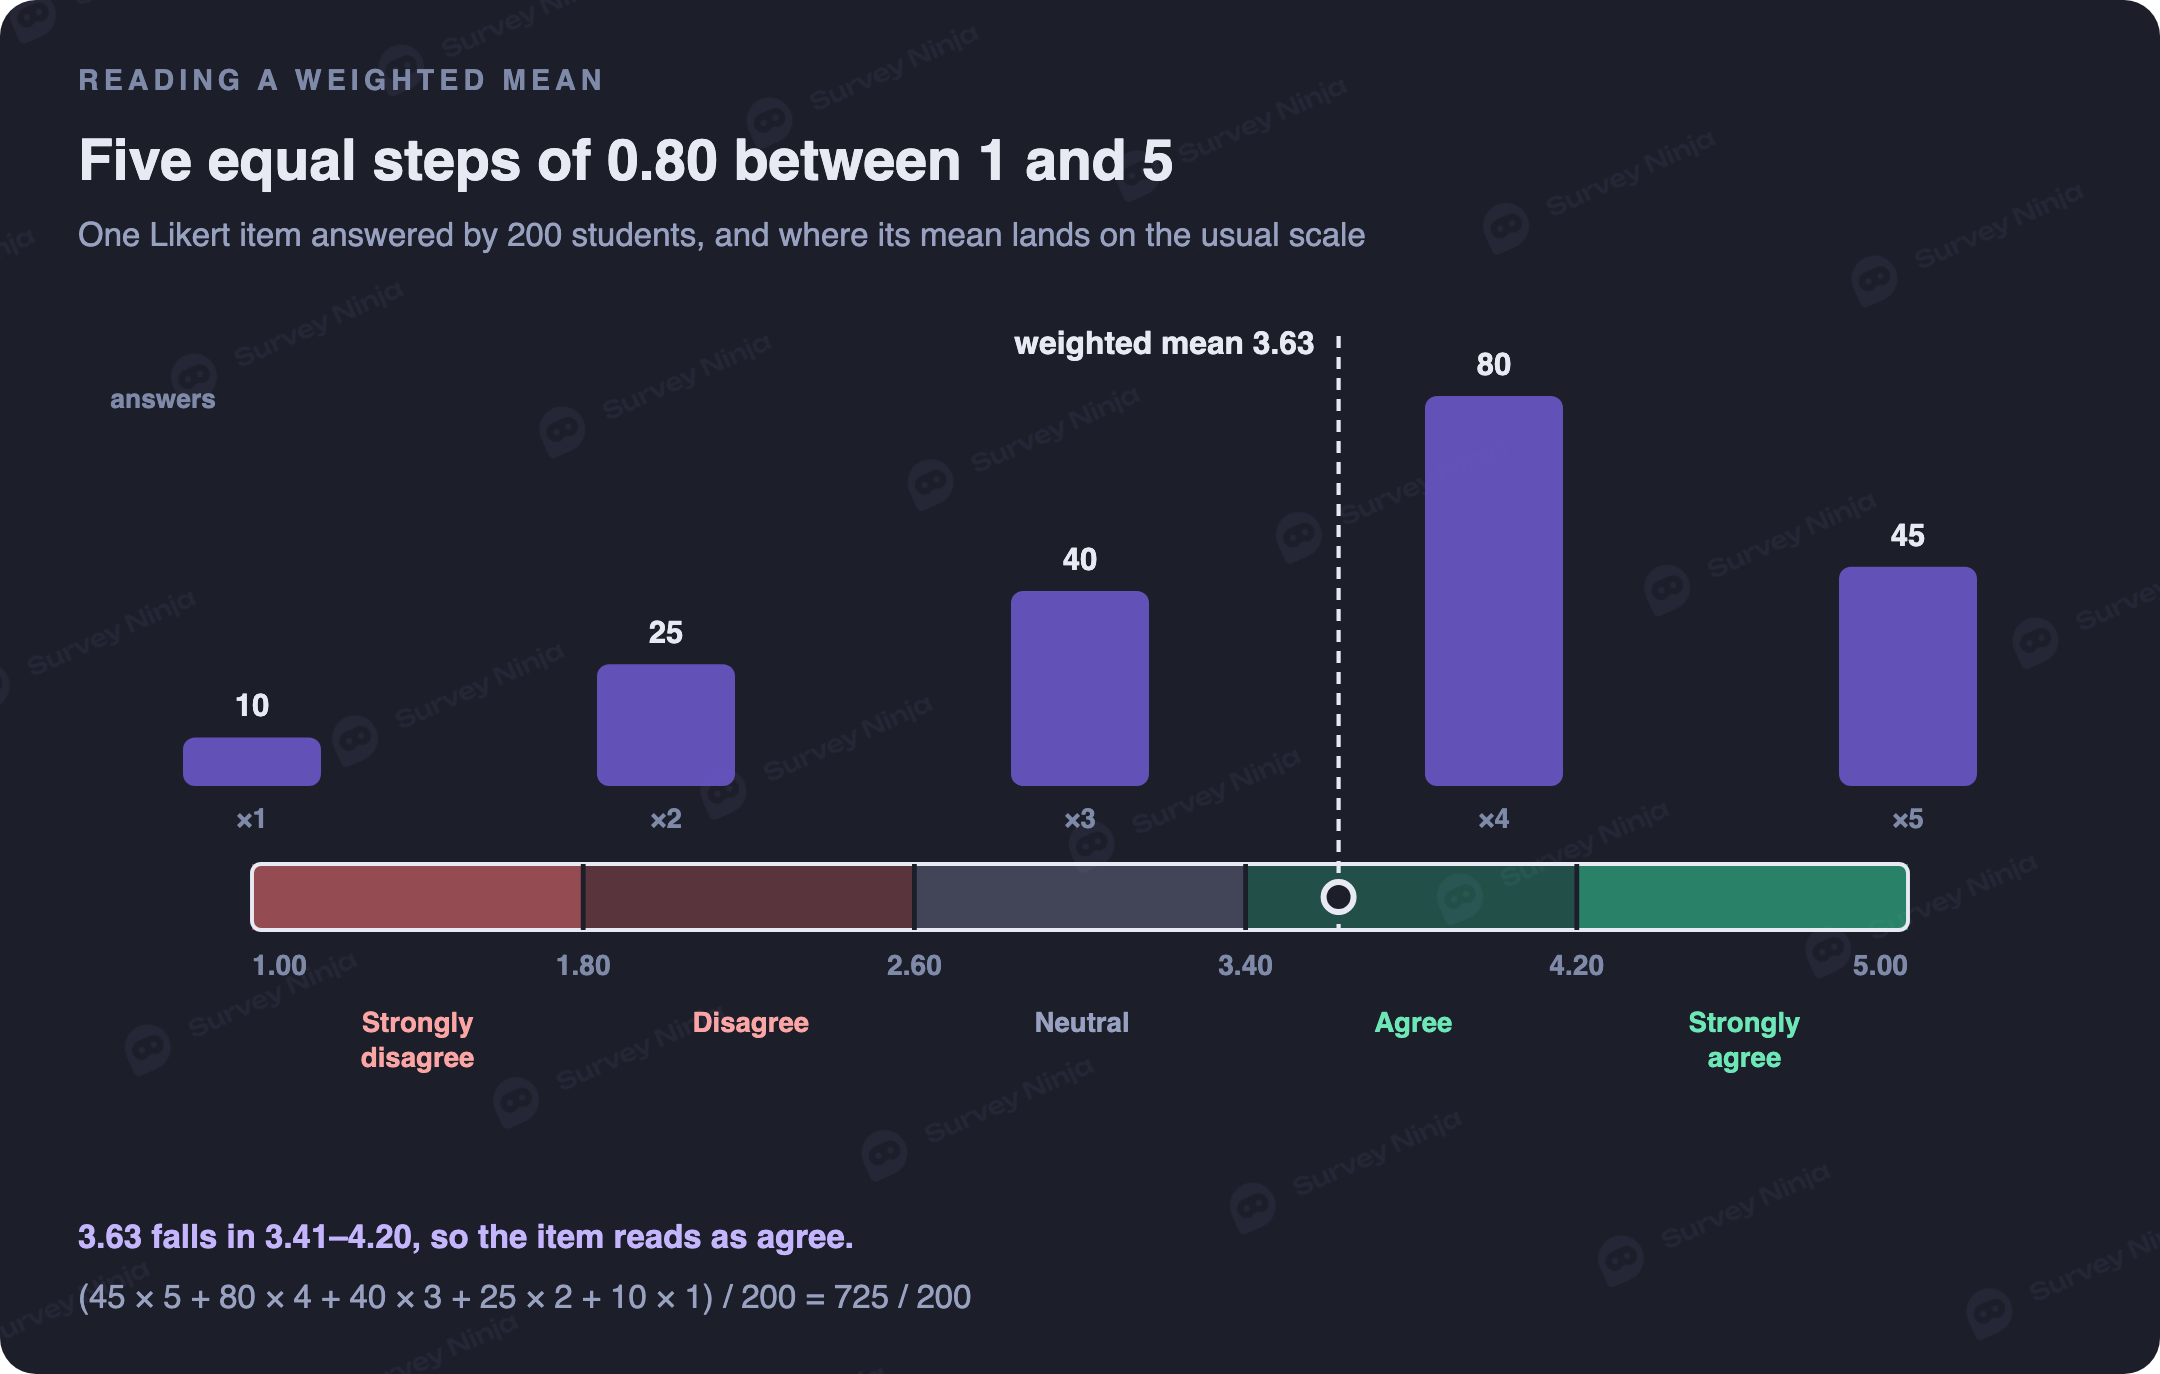
Take one item answered by 200 students: 45 strongly agree, 80 agree, 40 neutral, 25 disagree and 10 strongly disagree. The weighted mean is (45 × 5 + 80 × 4 + 40 × 3 + 25 × 2 + 10 × 1) / 200 = 725 / 200 = 3.63. It is simply the ordinary mean of the coded answers, computed from a frequency table.
The number says little until you read it against an interpretation scale. The usual one cuts the distance from 1 to 5 into five equal steps. The range is 5 − 1 = 4. Divided by five categories, it gives steps of 0.80:
| Weighted mean | Verbal interpretation |
|---|---|
| 4.21–5.00 | Strongly agree |
| 3.41–4.20 | Agree |
| 2.61–3.40 | Neutral |
| 1.81–2.60 | Disagree |
| 1.00–1.80 | Strongly disagree |
So 3.63 reads as agree. On a 4-point scale the step is 3 / 4 = 0.75, which gives 1.00–1.75, 1.76–2.50, 2.51–3.25 and 3.26–4.00. Whatever scale you use, say where the bands come from. A table of ranges with no explanation is an easy target for the panel.
Keep in mind what the weighted mean does not do: it describes, it does not test. "The level of agreement is high" is a description. "Male and female students differ" is a claim that needs a test. When the answers pile up at both ends, a mean of 3 hides a split, and our guide to descriptive analysis shows when the median tells the story better. If you are still building the questionnaire, the Likert scale guide covers labels, the number of points and reverse-worded items.
Can Likert answers go into a t-test?
A strict reading says no. Likert answers are ordinal, the distance between agree and strongly agree is unknown, so means and parametric tests should not apply. In practice the question has been settled differently. Norman (2010), in Advances in Health Sciences Education, went through studies going back to the 1930s and showed that the t-test, ANOVA and Pearson r are robust to these violations: with Likert data they rarely give the wrong answer.
A workable rule follows from that. When you average several items into one score per respondent, parametric tests are fine. When you test a single item, or the scores are clearly skewed, use the fallback from the table above. To check the distribution, the Shapiro–Wilk test is the usual choice, and Razali and Wah (2011) found it the most powerful of the common normality tests. Whatever you decide, write the rule into the section before you see the results.
Testing differences: t-test and ANOVA
The t-test for independent samples compares the means of two groups, such as male and female respondents. With three or more groups, such as three strands, use one-way ANOVA rather than a string of t-tests, because every extra test raises the chance of a false positive. If ANOVA finds a significant difference, a post hoc test such as Tukey's tells you which groups differ.
These questions are usually written as a null hypothesis: "There is no significant difference in the level of agreement between male and female respondents." The decision rule goes into the section too. If the p-value is below 0.05, the null hypothesis is rejected. Our glossary entry on statistical significance explains what a p-value does and does not tell you.
Testing relationships: Pearson r and chi-square
Pearson r measures a linear relationship between two scores, such as study hours and the level of agreement, on a scale from −1 to +1. Cohen (1988) suggested 0.10, 0.30 and 0.50 as small, medium and large, and a thesis reports both r and its p-value. Our Pearson correlation calculator returns r, r² and the p-value from two columns of data. Our guide to correlation in surveys explains why even a significant r does not show that one thing causes the other.
When both variables are categories, such as strand and preferred learning mode, the tool is the chi-square test of independence. It compares the counts you observed in a cross-table with the counts you would expect if the two variables were unrelated. The usual rule of thumb asks for an expected count of at least 5 in most cells. With fewer, use Fisher's exact test. Our chi-square calculator takes 2×2 and larger tables.
Reliability, significance level and software
If your instrument is a set of Likert items, the panel will also ask whether it is reliable. That is usually reported in the research instrument section, from the pilot test, with Cronbach's alpha. Some templates want it repeated here. Follow your school's template.
State the level of significance once: "All tests will use a 0.05 level of significance." Name the software and its version. Excel with the Analysis ToolPak covers frequencies, means, t-tests, one-way ANOVA and correlation. The free programs jamovi and JASP add post hoc tests, nonparametric tests and Shapiro–Wilk in a few clicks.
The data can come straight from the survey. You can build the questionnaire in SurveyNinja for free and export the answers to Excel, one column per question, ready for coding.
A model statistical treatment of data section
Here is a complete example for a descriptive-correlational study, written for a proposal. Replace the bracketed details and keep one tool per question.
The data will be tallied, tabulated and analyzed using Microsoft Excel and jamovi [version], with a 0.05 level of significance for all tests.
1. Frequency and percentage will be used to describe the profile of the respondents in terms of sex and strand (SOP 1), computed as P = (f / n) × 100.
2. The weighted mean will be used to determine the respondents' level of agreement on [topic] (SOP 2), computed as WM = Σ(f × w) / n and interpreted with the following scale: 4.21–5.00 strongly agree, 3.41–4.20 agree, 2.61–3.40 neutral, 1.81–2.60 disagree and 1.00–1.80 strongly disagree.
3. The independent samples t-test will be used to determine whether there is a significant difference in the level of agreement between male and female respondents (SOP 3). If the Shapiro–Wilk test shows that the scores are not normally distributed, the Mann–Whitney U test will be used instead.
4. Pearson r will be used to determine whether there is a significant relationship between the respondents' weekly study hours and their level of agreement (SOP 4).
In the final paper the same text moves to the past tense and names the software version that was actually used.
Common mistakes in the statistical treatment of data
- A tool listed with no question in the statement of the problem to answer.
- The weighted mean used to claim a significant difference. It describes, it does not test.
- Several t-tests run where one ANOVA was needed.
- Pearson r used for two categories, or chi-square for two scores.
- An interpretation scale with no word on where the bands come from.
- "Significant" written without a p-value or a level of significance.
- Formulas copied without saying what each symbol means.
The statistical treatment is the last promise Chapter 3 makes. Chapter 4 keeps it, question by question, in the same order.
Frequently asked questions
What is the statistical treatment of data in research?
It is the part of the methodology, usually at the end of Chapter 3, that names each statistical tool used in the study, the research question it answers, its formula and the level of significance, usually 0.05.
How do you make the statistical treatment of data?
Go through the statement of the problem one question at a time and assign one tool to each: frequency and percentage for the profile, the weighted mean for levels of agreement, a t-test or ANOVA for differences, Pearson r or chi-square for relationships. Then add the level of significance and the software.
What is the formula for the weighted mean?
WM = Σ(f × w) / n, where f is the number of respondents who chose an answer, w is its weight, from 5 for strongly agree to 1 for strongly disagree, and n is the total number of respondents.
What does a weighted mean of 3.41 to 4.20 mean?
On the usual 5-point interpretation scale it means agree. The scale splits the range from 1 to 5 into five equal steps of 0.80, so 4.21 to 5.00 is strongly agree and 3.41 to 4.20 is agree.
Should I use a t-test or ANOVA?
A t-test for two groups, one-way ANOVA for three or more. Running several t-tests instead of one ANOVA raises the chance of a false positive.
Can I use Pearson r with Likert data?
For a score averaged over several items, yes: Norman (2010) showed that Pearson r and other parametric methods hold up well with Likert data. For a single item or a clearly skewed score, Spearman's rho is the safer choice.
Published: Sep 30, 2026