 WooCommerce Post-Purchase Survey: 7 Questions, When to Ask and What to Do Next
Survey Bias: 16 Types, Examples and How to Avoid Each One
Survey design  Mike Taylor Nov 11, 2026 Reading time ≈ 18 min
Contents
- What survey bias is, and why a bigger sample won't fix it
- Types of survey bias: the master table
- Who you ask: sampling, non-response and survivors
- How you ask: wording, order and anchors
- How people answer: response biases
- How you analyze: confirmation bias in coding
- Survey bias checklist by stage
- How to reduce survey bias in SurveyNinja
- Frequently asked questions
Survey bias is a systematic error that pushes results away from the truth in one direction, so collecting more answers does not fix it. It enters at four points: who you ask, how you ask, how people answer and how you analyze. Below is one table of 16 types of survey bias with an example and a fix for each, then a checklist for every stage of a study.
The word itself has a general meaning in research, covered in our glossary entry on bias. This guide is practical: where each bias comes from in a real survey, what it looks like in the data and what you can change before launch.
Key points
- Survey bias is a systematic error that pushes results in one direction, so a larger sample shrinks random error but leaves the bias the same size.
- Bias enters through who you ask, how you ask, how people answer and how you analyze the results.
- Word questions neutrally with balanced, labeled scales, randomize unordered answer lists and keep sensitive questions anonymous.
- Code open answers against a codebook written before reading them, have a second person code a sample, and report every theme with its count.
What survey bias is, and why a bigger sample won't fix it
Every survey has two kinds of error. Random error comes from asking a sample rather than everyone. It scatters results around the true value in both directions, and it shrinks as the sample grows, which is what a sample size calculator plans for. Bias moves results in one direction and stays put no matter how many people answer. Double the sample and you get the same wrong answer with more confidence.
The classic case is the 1936 Literary Digest poll of the US presidential election. The magazine mailed ten million ballots and got almost 2.4 million back. It predicted that Alf Landon would win 54% of the popular vote. Franklin Roosevelt won with more than 60%. As Sharon Lohr and J. Michael Brick recount in a 2017 paper, the mailing list came largely from telephone directories and car registrations, and only about a quarter of the ballots came back. Later analyses blame both the list and the low response. Two million answers did not help, because the people who answered were not like the people who voted.
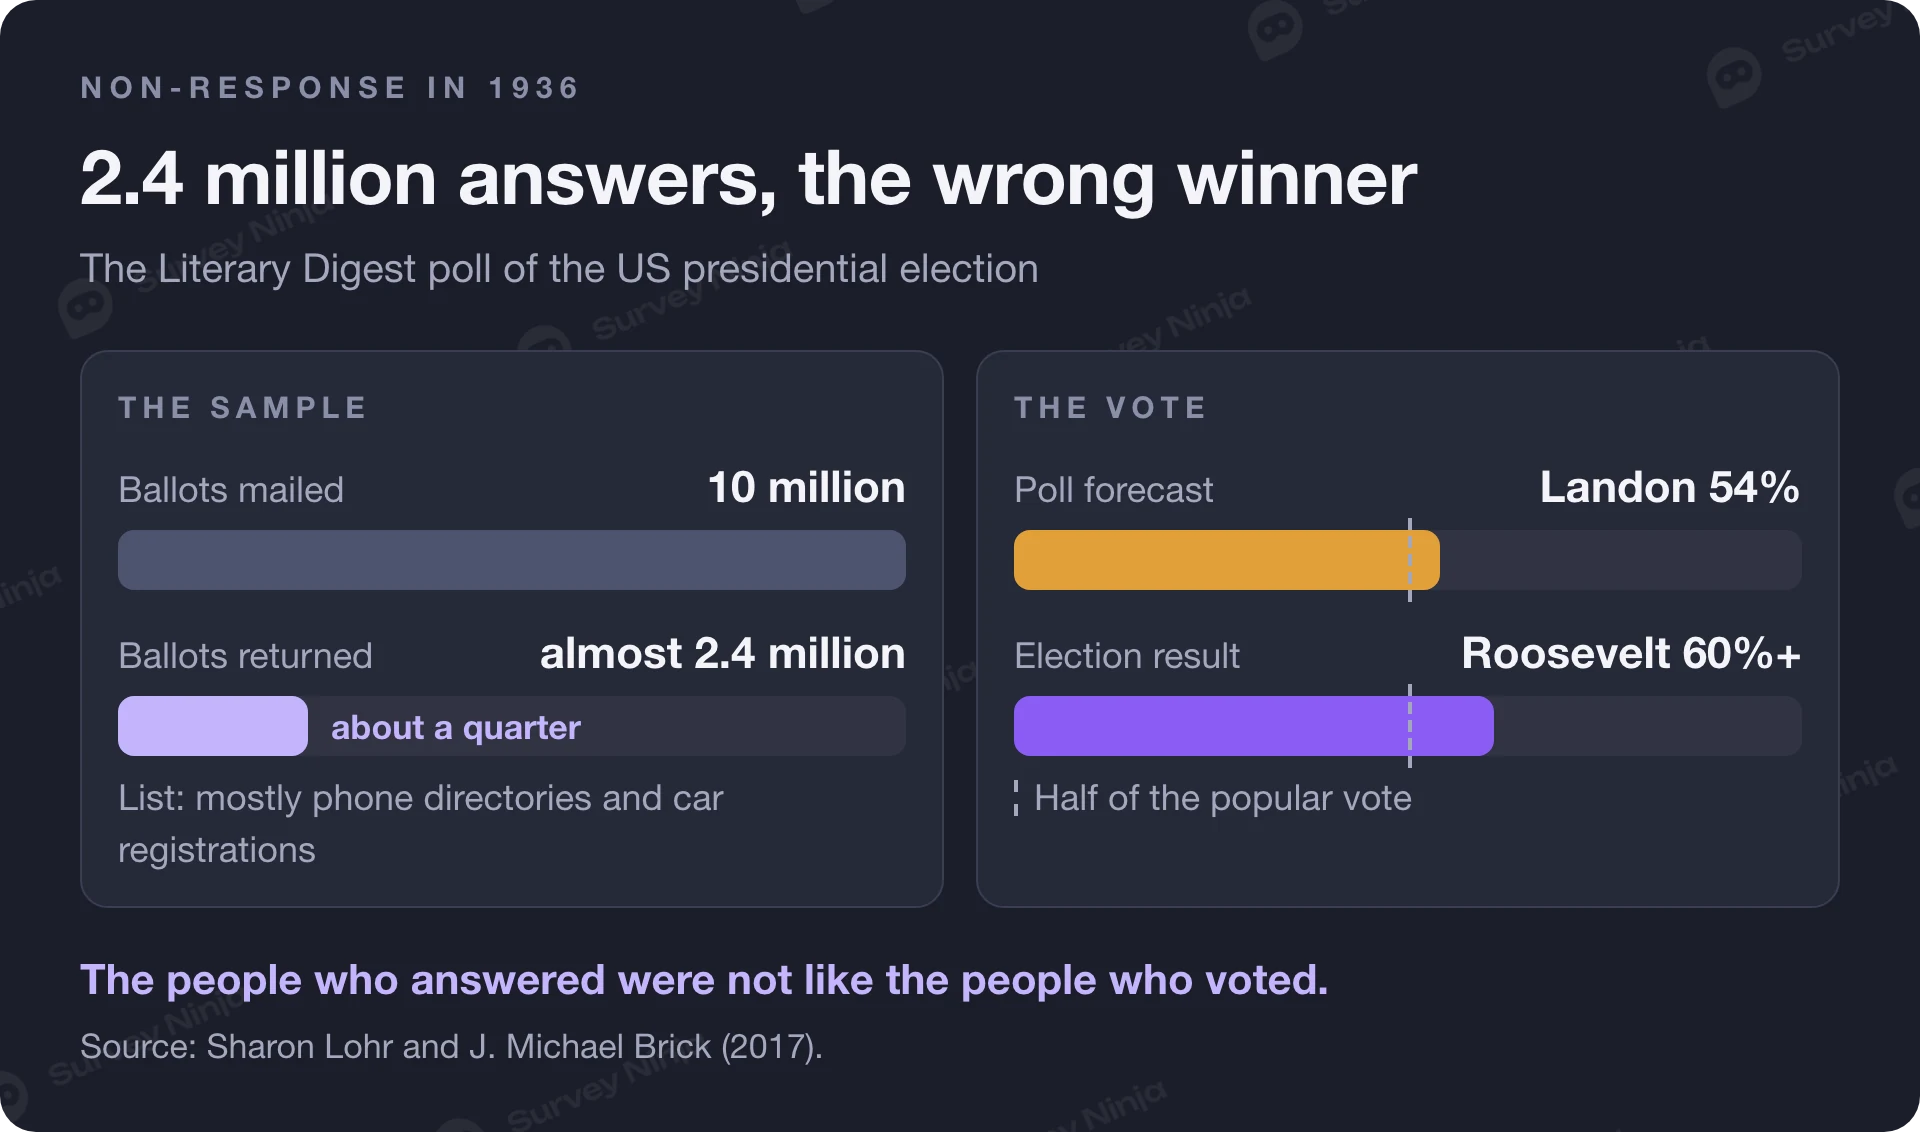
The same logic applies to a customer survey with 300 responses or an employee survey with 50. Before counting answers, ask if the ones you have could lean one way.
Types of survey bias: the master table
The table groups 16 common biases by the point where they enter the study. The first column links to a glossary entry where we have one.
| Bias | Enters through | Example | Fix |
|---|---|---|---|
| Selection bias | Who you ask | A survey about remote work sent only through the office intranet | Define the population first, then a sampling frame that covers it |
| Non-response bias | Who you ask | Only the angriest and the happiest customers reply to a satisfaction survey | Reminders, a short survey, and a comparison of respondents with the full list |
| Survivorship bias | Who you ask | Asking current customers why customers stay, and never asking those who left | Survey the people who dropped out too, such as churned customers or former staff |
| Convenience sampling | Who you ask | Posting the link on your own social account and treating replies as "the market" | Use it for ideas only, or set quotas that match the population |
| Leading or loaded wording | How you ask | "How much did you enjoy our improved app?" | Neutral wording and a balanced scale |
| Question order and context | How you ask | Rating overall satisfaction right after five questions about delivery problems | Ask general questions before specific ones, keep order fixed across waves |
| Anchoring | How you ask | "Most people pay about $50. What would you pay?" | Remove reference numbers from the question, or test two versions |
| Primacy effect | How you ask | On screen, the first options in a long list are picked more often | Random order of unordered options, shorter lists |
| Recency effect | How you ask | On the phone, the last option read aloud is picked more often | Random or reversed order, fewer options per question |
| Acquiescence bias | How people answer | Agreeing with "The training was useful" and with "The training was a waste of time" | Ask people to choose between two statements instead of agree or disagree |
| Social desirability bias | How people answer | Staff overstate how often they follow safety rules when they expect a manager to see the answers | Anonymity, neutral wording, answer options that make the honest answer easy to give |
| Central tendency bias | How people answer | A manager rates every team member 3 out of 5 | Labeled points, concrete behaviors to rate, an explicit "Don't know" |
| Extreme responding | How people answer | Some respondents use only 1 and 5 whatever the question | Labeled scales, and comparing groups on distributions as well as averages |
| Recall bias | How people answer | "How many times did you contact support last year?" | Short reference periods, such as the past 7 or 30 days |
| Halo effect | How people answer | A friendly waiter lifts the score for food, price and cleanliness | Ask about specific attributes and behaviors, and vary their order |
| Confirmation bias in coding | How you analyze | Tagging open answers with the themes you already expected | Codebook before reading, a second coder, and every theme counted |
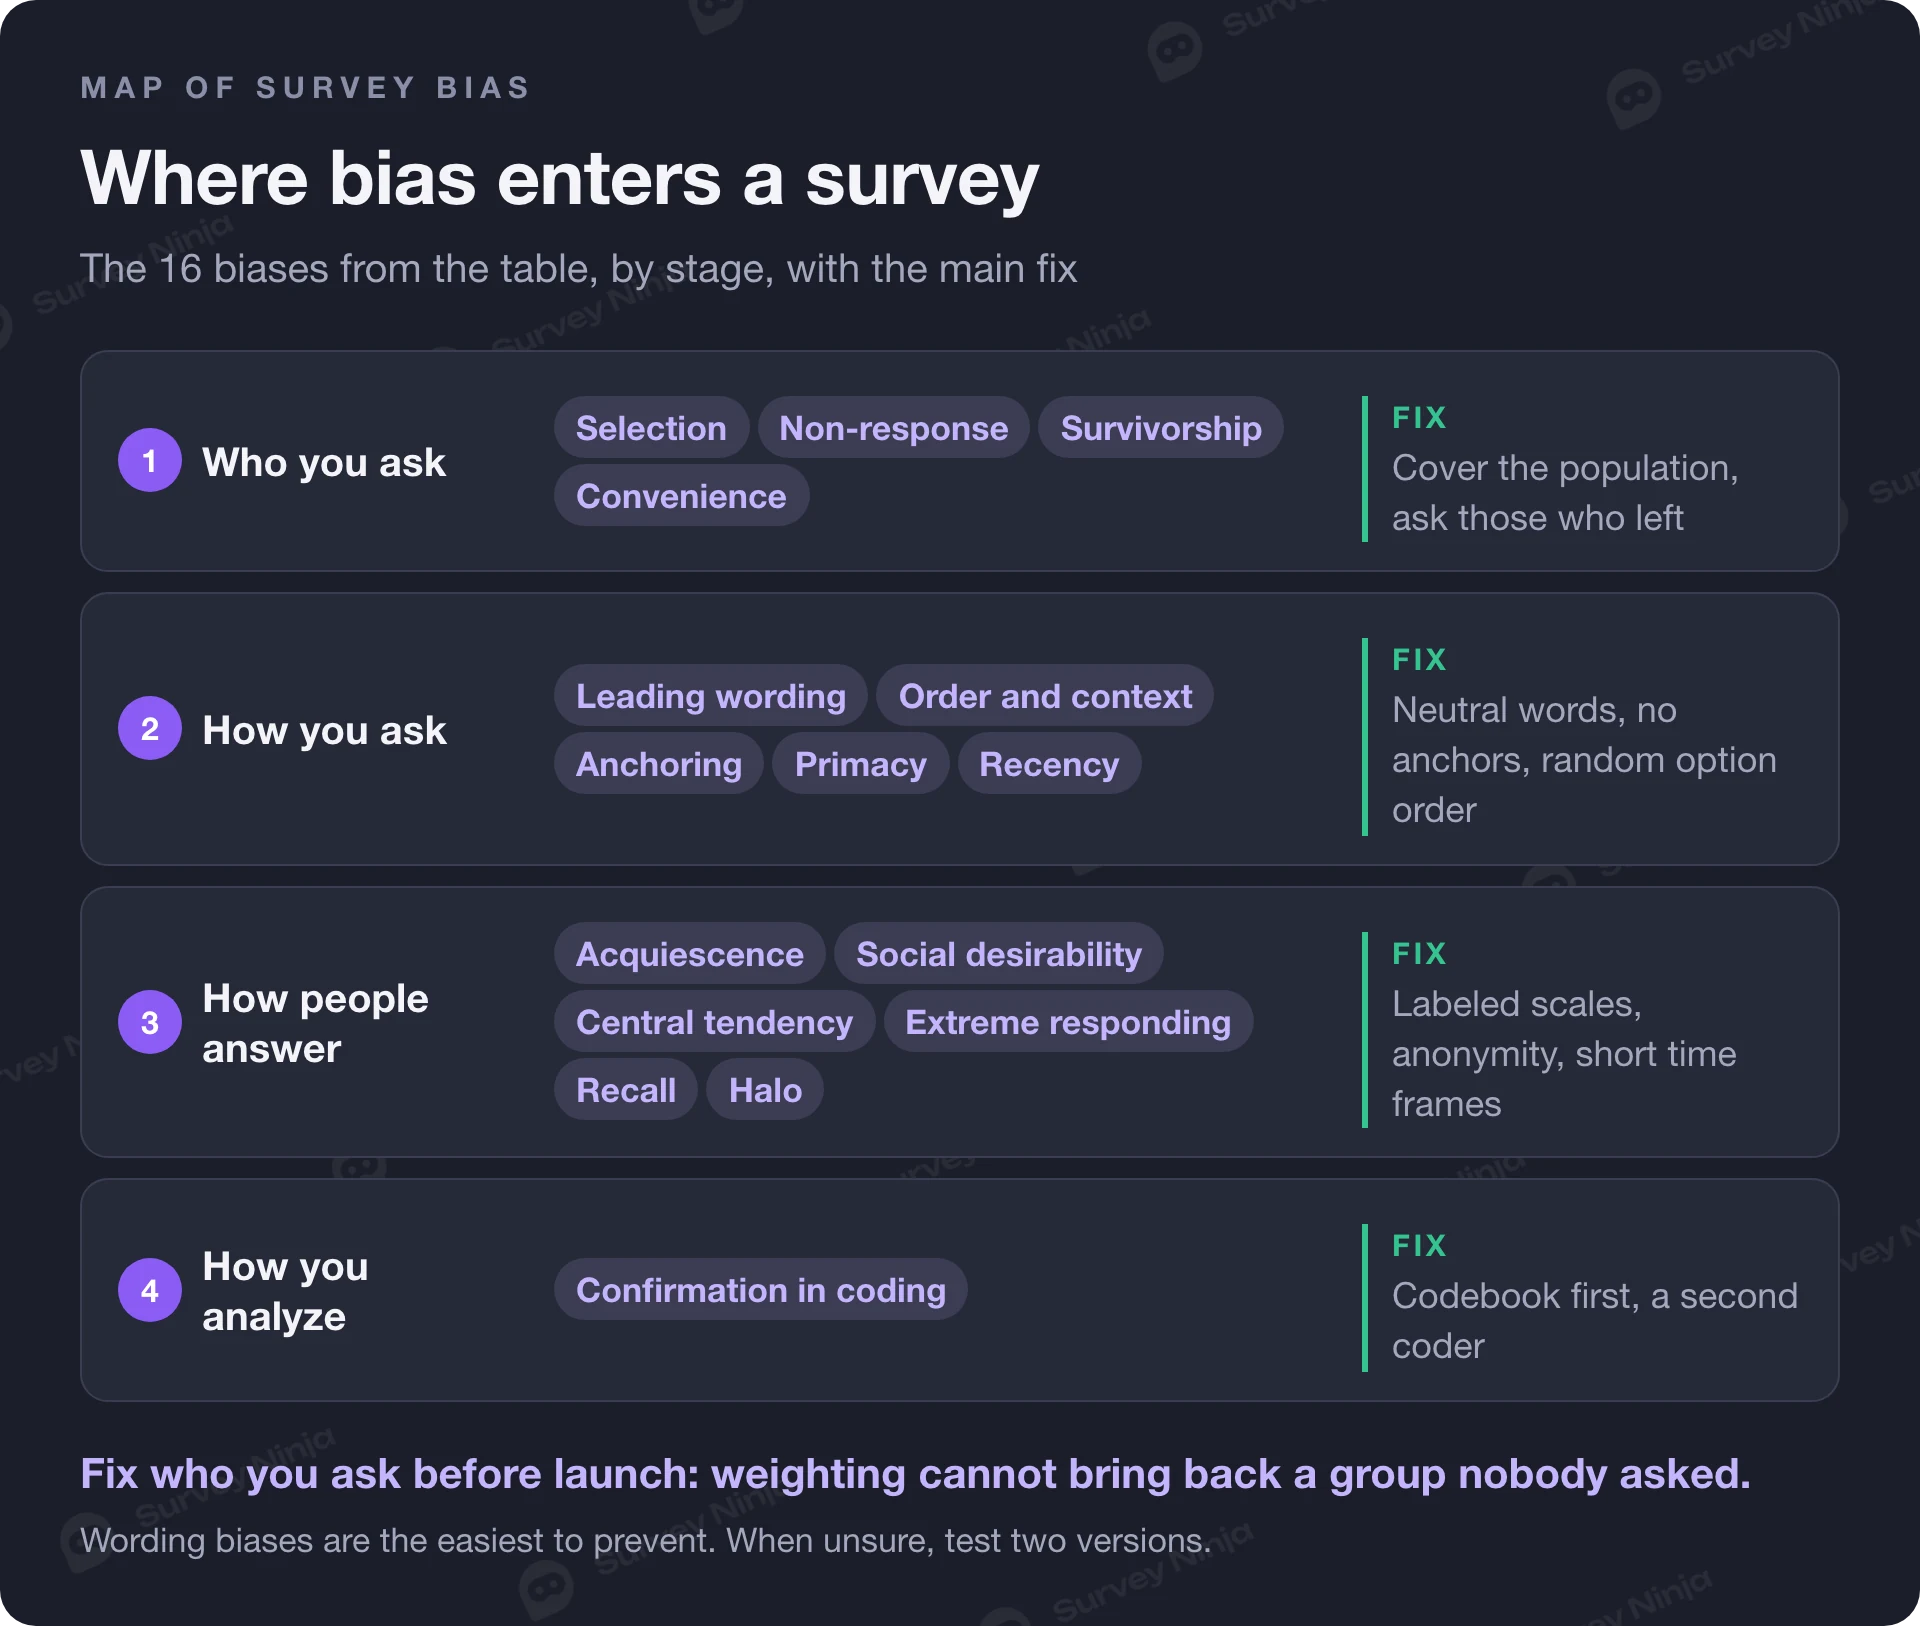
The rest of this guide goes through the four groups, with the evidence behind the main fixes.
Who you ask: sampling, non-response and survivors
Sampling biases decide whose opinion your results describe. They are the hardest to fix after fieldwork, because no amount of weighting brings back a group that was never in the sample.
Selection bias starts with the list. A survey sent only to newsletter subscribers describes subscribers. A pop-up on your pricing page describes people considering a purchase. Both are fine if that is the group you want. The error is reporting them as "our customers". The strongest protection is a probability sample, where every member of the population has a known chance of being picked; our article on probability sampling explains the main designs. When that is out of reach, quotas on the few traits that matter most, such as plan, region or tenure, keep the sample from drifting.
Non-response bias appears when the people who answer differ from those who don't on the thing you measure. A high response rate helps but is no guarantee. The American Association for Public Opinion Research notes in its overview of response rates that surveys with less than optimal response rates have sometimes shown the least bias. The practical check is to compare respondents with the full list on what you already know: plan, region, signup date, purchase history. If respondents are twice as likely to be on a paid plan, read the results with that in mind, or weight them. If the survey is anonymous, compare totals instead: ask one or two of those traits in broad categories and set them against the same totals for the full list, without matching answers to names.
Survivorship bias is selection bias with a story. In the Second World War, the statistician Abraham Wald studied the damage on aircraft that came back from missions. His point, described by Mangel and Samaniego (1984), was that the planes that never returned held the missing information. In customer research, the planes that did not return are churned customers, rejected candidates and employees who quit. A retention survey of current customers will always find that customers like you. Ask the people who left as well, where they have agreed to hear from you.
Convenience sampling, asking whoever is easy to reach, is fine for testing questions or collecting ideas. It becomes a problem when the percentages are presented as if they described a wider population.
How you ask: wording, order and anchors
Question biases come from the instrument itself, which makes them the easiest to prevent. Pew Research Center's methods guide on writing survey questions documents how much they move results. In one 2003 poll, support for legal agreements giving same-sex couples the same rights as married couples was 45% when asked right after a question on marriage, and 37% without it. That is context bias: an earlier question changes how people read a later one.
Wording works the same way. Pew reports that in 2005, 51% favored making it legal for doctors to give terminally ill patients "the means to end their lives", while 44% favored letting doctors "assist terminally ill patients in committing suicide". Most wording bias in business surveys is less dramatic and more frequent: praise in the question, a scale with more positive than negative options, a premise the respondent is expected to accept. Our guide on how to write survey questions has 12 rules with rewrites, and the free AI Survey Improver flags leading, double-barreled and vague questions in a draft you paste in.
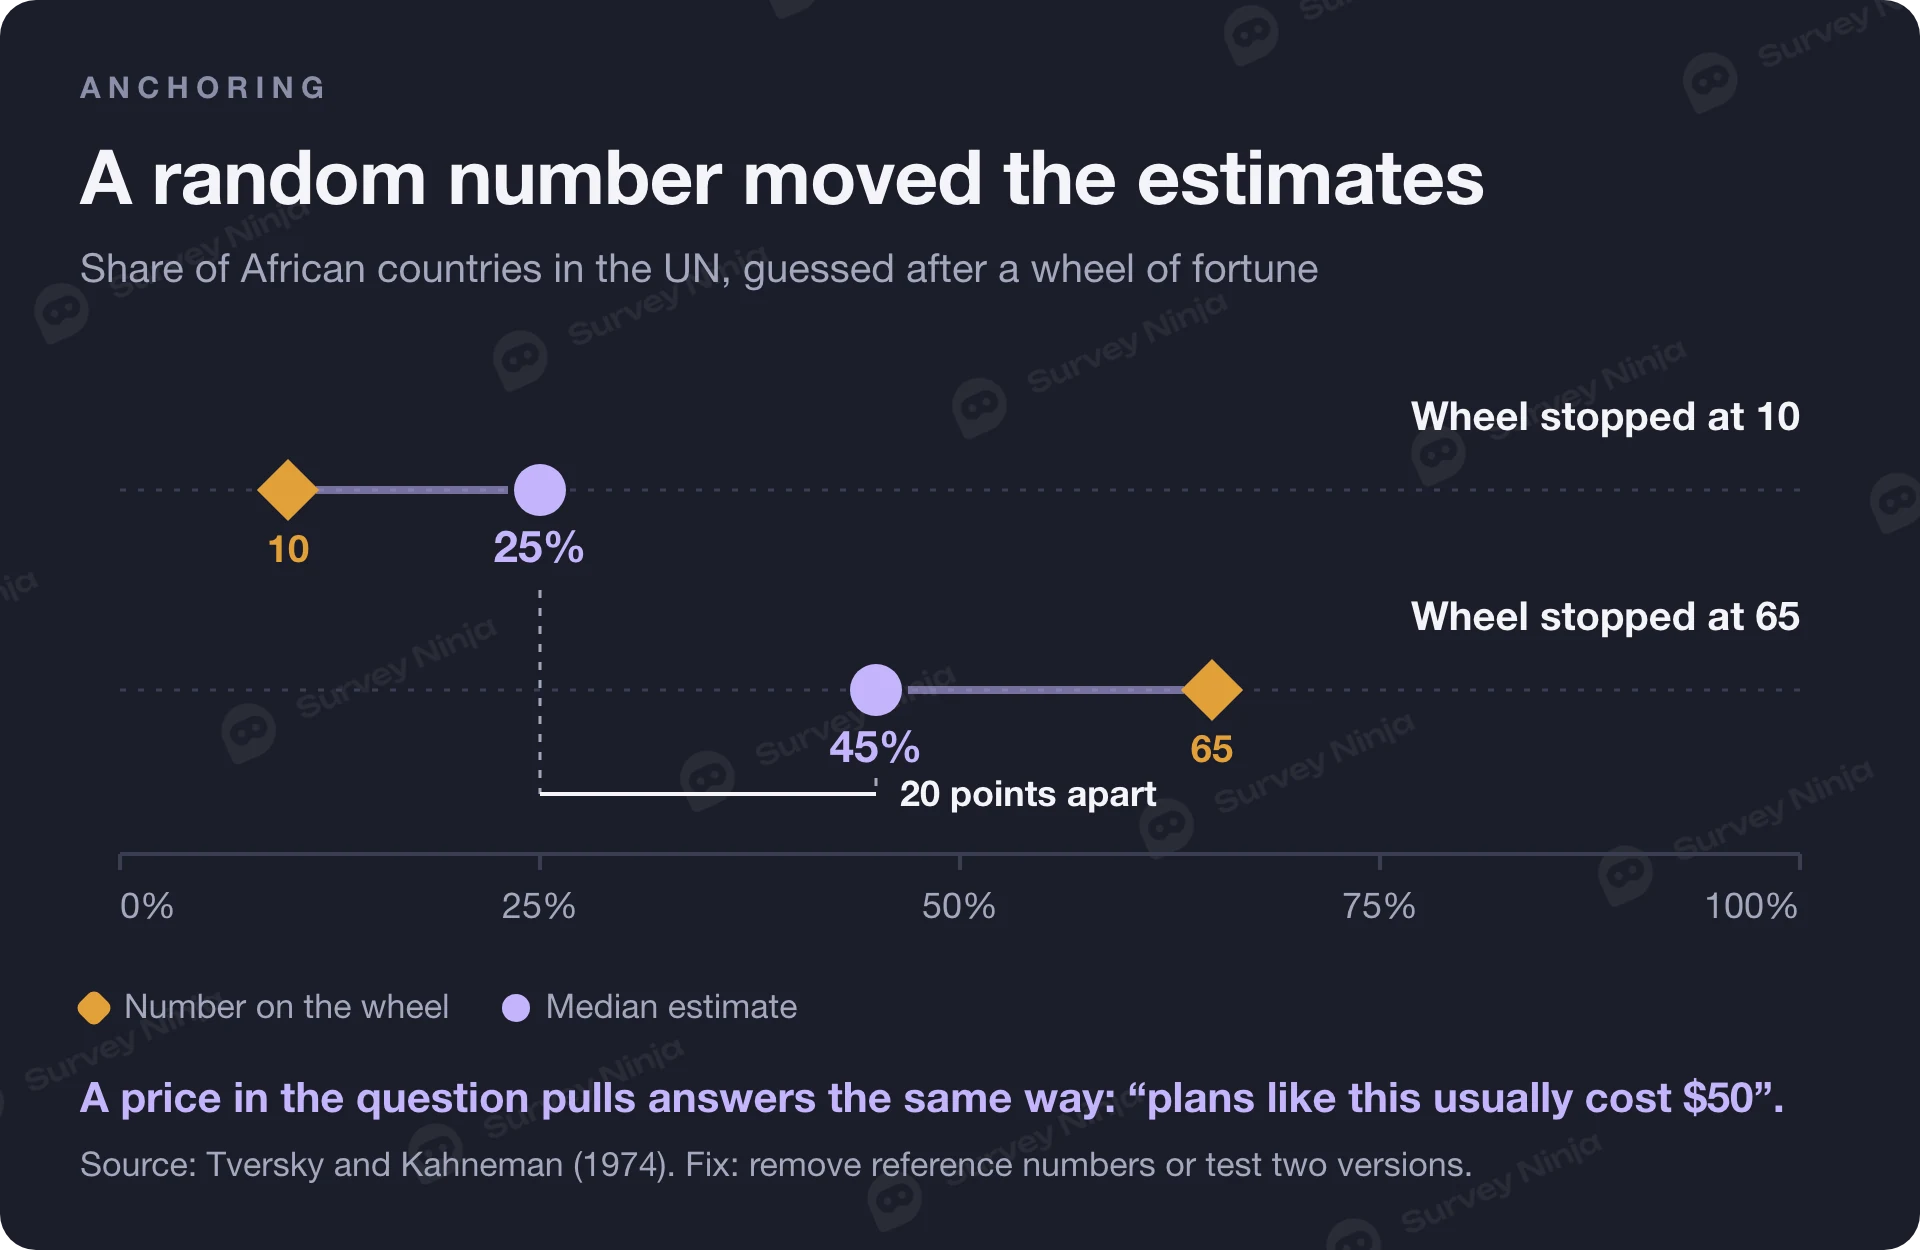
Anchoring happens when a number in the question pulls the answer toward it. In Tversky and Kahneman's 1974 study, people first saw a wheel of fortune stop at 10 or 65, then estimated the share of African countries in the United Nations. The median estimates were 25% and 45%. A survey that says "plans like this usually cost $50" before asking about willingness to pay does the same thing.
Response order effects depend on the mode. Pew notes that people who read a list tend to pick items near the top, the primacy effect, while people who hear a list on the phone tend to pick the last ones, the recency effect. Pew randomizes most lists so that no option always sits in the same place. It does not randomize ordered scales; it reverses them for half the sample. Randomization spreads the effect evenly across options and keeps it from favoring any one of them.
When you are unsure which of two wordings is neutral, test both. Split the sample, show each half one version and compare. If the answers differ a lot, the wording is doing some of the answering.
How people answer: response biases
Response bias is the umbrella term for the ways people answer inaccurately even when the question and the sample are sound. Five types turn up in nearly every survey.
Acquiescence. Some people tend to agree with whatever statement they are shown. Pew finds the tendency stronger among less educated and less informed respondents, and stronger when an interviewer is present. Its recommended fix is to offer a choice between two statements, for example "Our team has enough time for training" against "Our team does not have enough time for training", instead of an agree-disagree scale.
Social desirability. People present themselves well. Pew lists behaviors people understate, such as drinking and tax evasion, and behaviors they overstate, such as voting, church attendance and charitable giving. In a workplace the same pull applies to safety rules, overtime and opinions about the boss. Anonymity helps, and so does wording that makes the honest answer normal: "Some people have had time to read the new policy and some have not. Have you?" Our article on anonymous surveys covers what anonymity has to include for people to believe it.
Central tendency and extreme responding. Some people avoid the ends of a scale, others use only the ends. Both distort averages and make groups look more or less different than they are. Label every point, ask about concrete behavior, and look at the distribution of answers as well as the mean.
Recall. Memory is reconstructive. People forget minor events, move memorable ones into the period you asked about, and fill gaps with what they usually do. Short reference periods and questions tied to a recent event, such as "your last order", give more accurate counts.
Halo effect. One strong impression colors every other rating. Edward Thorndike described it in 1920 in "A constant error in psychological ratings", after noticing that officers' ratings of their men on very different traits correlated too strongly to be real. Ask about specific attributes in concrete terms, and put the overall rating either first or last, then keep that order.
How you analyze: confirmation bias in coding
Bias does not stop when fieldwork ends. Open answers are where analysis bias does the most damage, because coding them takes judgment. A reader who expects to find complaints about price will find them, and will file mixed comments under "price" too.
Three habits keep coding honest:
- Write the codebook before reading the full set: theme names, definitions and an example of each. Add new themes only with a note on why.
- Have a second person code a sample of the same answers and compare. Where you disagree, the definition needs work.
- Report every theme with its count, including the ones that contradict your hypothesis.
The same applies to quantitative analysis. Decide which comparisons you will run before you look at the data. If you check twenty segments, one or two will show a "significant" difference by chance alone.
Survey bias checklist by stage
Use this list before launch and again before you share results.
Design
- Each question asks about one thing, in neutral words, with a clear time frame.
- Scales are balanced and labeled, lists include "Other" or "Not applicable".
- No reference numbers or examples that could act as an anchor.
- General questions come before specific ones on the same topic.
- Unordered lists are randomized, ordered scales stay in order.
- Sensitive questions are worded so that the honest answer is easy to give.
Sampling
- The population is written down, and the list or channel actually reaches it.
- People who left, refused or dropped out are included where they matter.
- Quotas or weights are planned for the traits that matter most.
- The target number of responses comes from a sample size calculation.
Fielding
- A pilot with a few people from the audience has been run and the findings fixed.
- The invitation is neutral and does not hint at the answer you hope for.
- Reminders go only to people who have not answered yet. In an anonymous survey, where you should not know who answered, one reminder goes to everyone.
- Anonymity is real (no names, personal links or identifying combinations of traits) and explained in one sentence at the start.
- Respondents are compared with the full list on known traits while fieldwork is still open, as totals if the survey is anonymous.
Analysis
- Planned comparisons were written down before looking at the data.
- Distributions are checked as well as averages.
- Open answers are coded against a codebook, with a second coder on a sample.
- The report states who answered, how many, and who is missing.
How to reduce survey bias in SurveyNinja
Several settings in the survey builder target the biases above, and all of them are on every plan, including Free. Random order of questions and answer options spreads primacy and order effects across options. Anonymous mode makes honest answers to sensitive questions easier. Anonymity also depends on the questions: in a small team, a name field or a combination such as department and tenure can still point to one person, so leave those out of a survey you call anonymous. Skip logic shows each question only to people it applies to, so nobody is pushed into answering about something they never used. You can create a survey for free and switch these on in the settings.
For wording, the A/B test of a question shows two versions of a question's title and description to different respondents. The export has a column with the version each person saw, and from the Standard plan the report names the leader by completion with a confidence level. Before you build, paste your draft into the AI Survey Improver to catch leading and double-barreled questions, and use the sample size calculator to plan how many responses you need.
Frequently asked questions
What is survey bias?
Survey bias is a systematic error that pushes results in one direction, away from what the population really thinks or does. It can come from who is asked, how questions are worded and ordered, how people choose to answer, or how the data is analyzed. Unlike random error, it does not shrink when you collect more responses.
What are the main types of survey bias?
They fall into four groups. Sampling biases decide who answers: selection, non-response, survivorship and convenience sampling. Question biases come from wording, order, anchors and response order. Response biases come from the respondent: acquiescence, social desirability, central tendency, extreme responding, recall and the halo effect. Analysis biases, such as confirmation bias in coding, come from the researcher.
What is an example of response bias?
Social desirability bias is a common one: people overstate behavior that looks good, such as voting or charitable giving, and understate behavior that looks bad. Acquiescence is another: some respondents agree with almost any statement, so they agree with two opposite claims in the same survey. Both can be reduced through anonymity and question design.
How do you avoid bias in a survey?
Define the population and reach it with a sound sample, word questions neutrally with balanced, labeled scales, randomize unordered answer lists, and keep sensitive questions anonymous. Pilot the survey with a few people before launch. During analysis, plan comparisons in advance and code open answers against a codebook written before reading them.
Does a larger sample reduce survey bias?
No. A larger sample reduces random error, the scatter around the true value, but bias moves every answer in the same direction and stays the same size. The 1936 Literary Digest poll collected almost 2.4 million ballots and still predicted the wrong winner, because the people who answered differed from the people who voted.
What is the difference between selection bias and non-response bias?
Selection bias happens when the people invited do not represent the population, for example a survey sent only to newsletter subscribers. Non-response bias happens when the people invited are representative, but those who choose to answer differ from those who stay silent. The first is a problem with the list, the second with who responds.
Published: Nov 11, 2026