 WooCommerce Post-Purchase Survey: 7 Questions, When to Ask and What to Do Next
How to Analyze Survey Data with AI and Check What It Tells You
Research methods  Mike Taylor Nov 13, 2026 Reading time ≈ 19 min
Contents
- Where AI helps in survey analysis, and where it does not
- How to analyze survey data with AI in five steps
- Step 1: Clean the data and remove personal data
- Step 2: Compute closed questions with formulas
- Step 3: Code open answers into themes with AI
- Step 4: Check the AI before you trust it
- Step 5: Write conclusions that hold up
- Common mistakes in AI survey analysis
- How to analyze survey data with AI in SurveyNinja
- Frequently asked questions

To analyze survey data with AI, split the work in two. Let formulas compute every number, and use a language model where it is strong: reading open-ended answers and coding them into themes. Then check the model before anything reaches a report. This guide gives the five-step workflow, four copy-ready prompts and a verification table you can run in an afternoon.
The split matters because a language model writes fluent text whether or not the text is right. A theme summary that sounds convincing can rest on a miscount, a merged category or a quote nobody wrote. The workflow below keeps the model on the task it does well and puts a cheap check after each step.
Key points
- To analyze survey data with AI, let formulas compute every number and use a language model to read open-ended answers and code them into themes.
- Remove personal data before pasting answers into an external AI tool, and replace each respondent with an ID whose key stays in a separate file.
- Have the model build a codebook from a sample, label every answer with it, and then count the labels yourself with COUNTIF or a pivot table.
- Before reporting, code 40 to 50 random answers by hand to compare with the AI's labels and search the raw data for every quote.
Where AI helps in survey analysis, and where it does not
AI survey analysis is most useful on free text. Reading 600 answers to "What should we improve?" takes a person most of a day; a model can propose themes and label every answer in minutes. Numbers are a different job. A rating average, a share of top-two-box answers or a difference between two groups has one correct value, and a spreadsheet formula gets it right every time. A language model produces numbers by predicting text, so it can return a percentage that looks plausible and is simply wrong.
| Task | Who should do it | Why |
|---|---|---|
| Remove duplicates, speeders, empty rows | Rules in a spreadsheet or script | The rules must be the same for every row and written down |
| Averages, shares, distributions of closed questions | Formulas or code | One correct answer; formulas are exact and repeatable |
| Differences between groups and their size | Formulas, an effect size calculator | Needs real arithmetic on real counts |
| Proposing themes for open answers | AI, reviewed by you | Fast first draft of a codebook from hundreds of answers |
| Labeling each open answer with a theme and sentiment | AI, spot-checked by you | Repetitive reading at scale, where models do well |
| Counting how many answers fall in each theme | Formulas on the AI's labels | Counting is arithmetic, so the model should not do it |
| Picking quotes and writing conclusions | You, with AI drafts | Every quote and claim has to be traceable to the data |
In short, the model reads and labels, and formulas count.
How to analyze survey data with AI in five steps
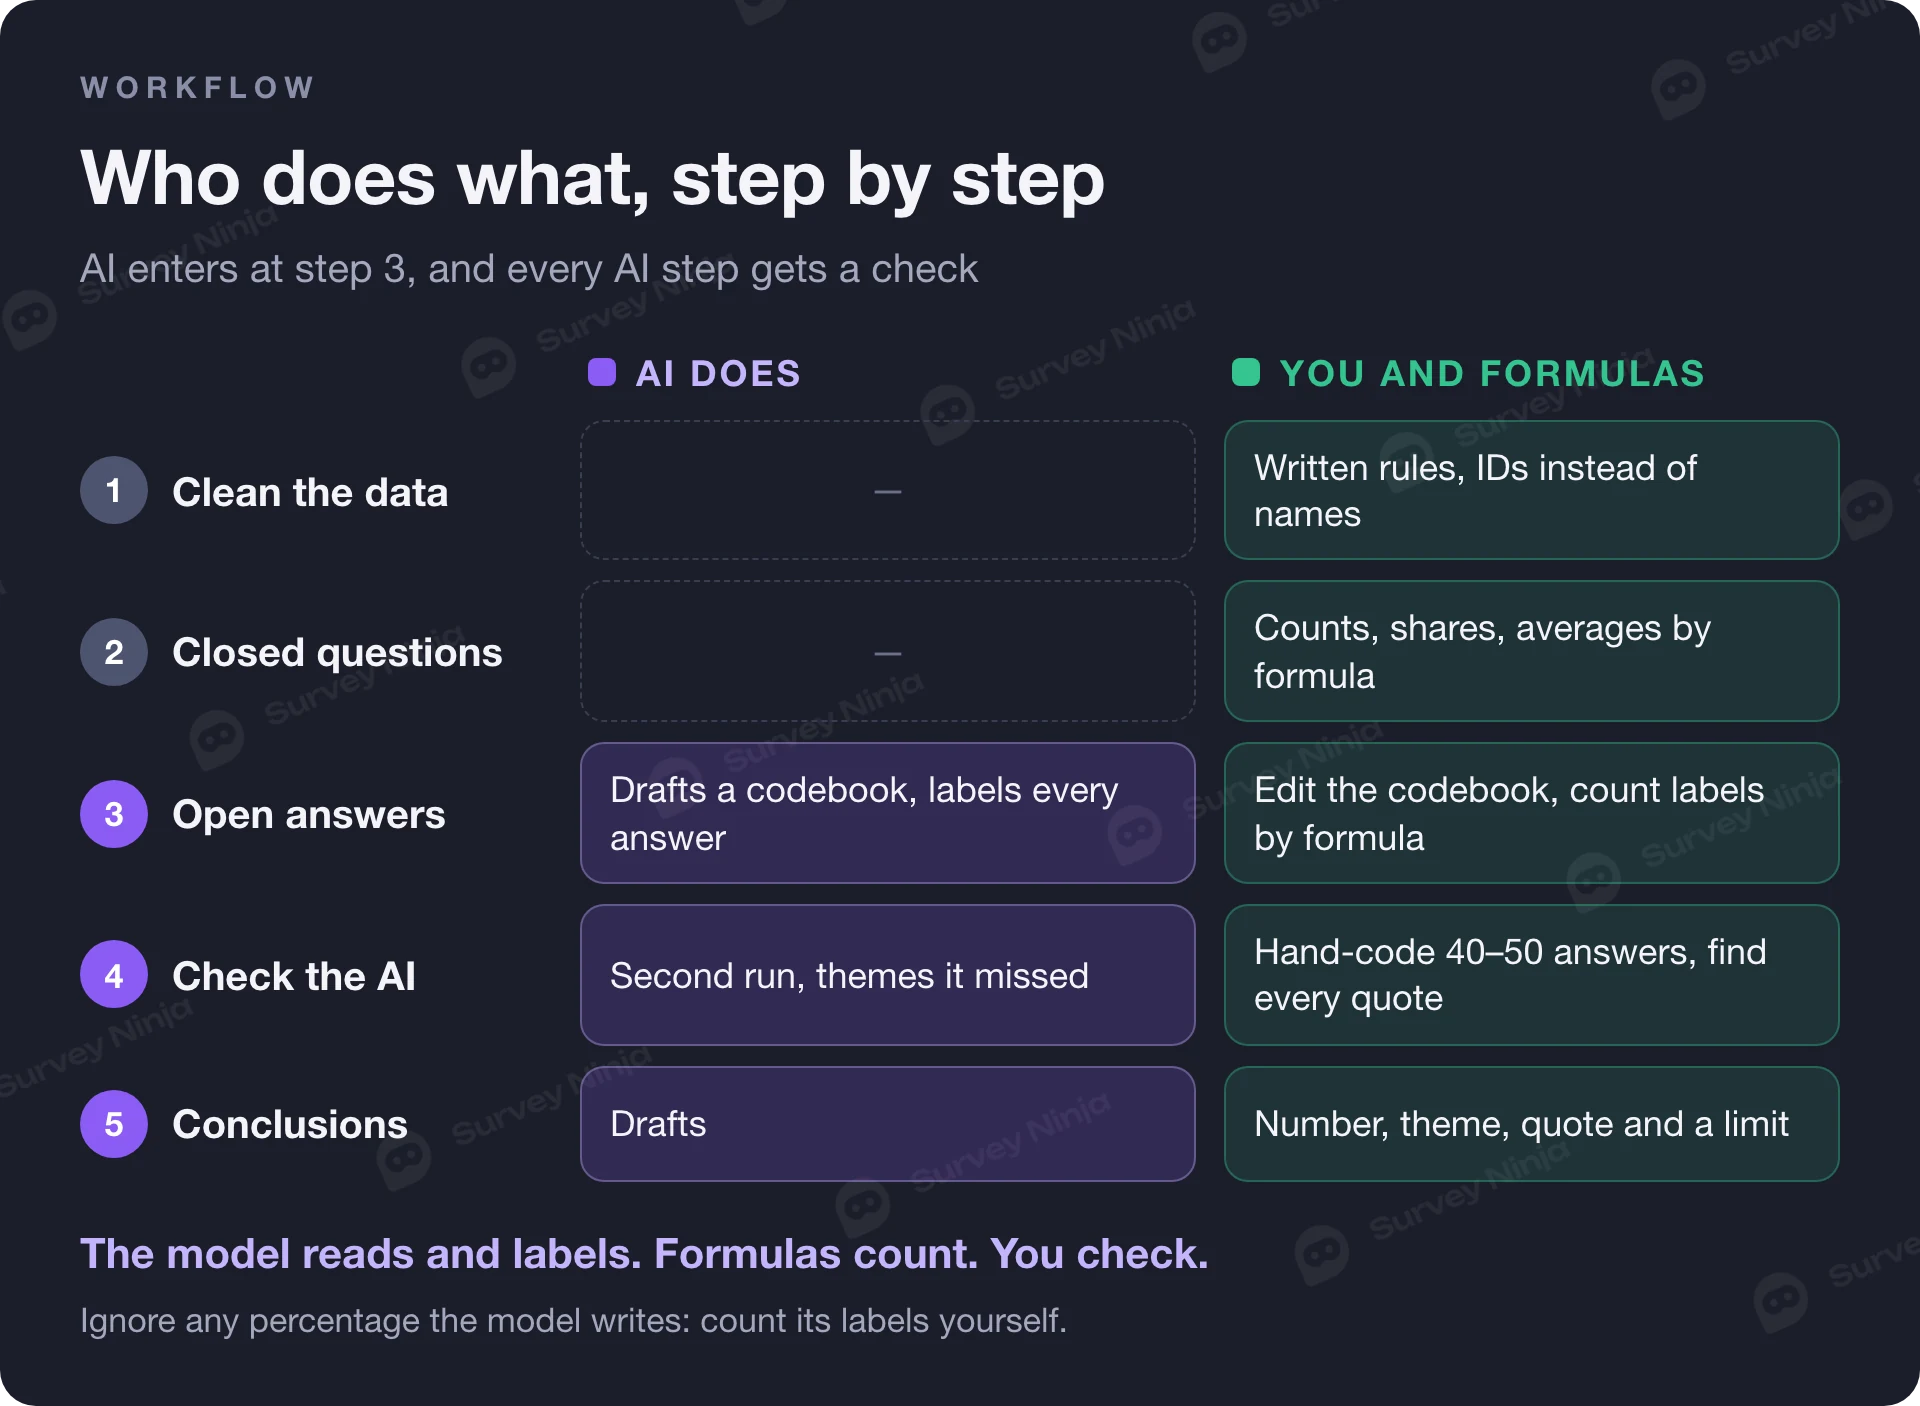
The workflow follows the order a careful analyst would use anyway. AI only enters at step three.
- Clean the data and remove personal data.
- Compute the closed questions with formulas.
- Code the open answers into themes with AI.
- Check the AI with the verification table.
- Write conclusions that combine numbers, themes and checked quotes.
Step 1: Clean the data and remove personal data
Export the responses to CSV or XLSX and work on a copy. Remove test submissions, exact duplicates and incomplete rows you do not plan to use. Then look for low-quality answers: people who finished a ten-minute survey in ninety seconds, picked the same column in every grid, or typed "asdf" into every text box. The survey data cleaning calculator helps you set thresholds for speeders and straight-liners and shows how many rows each rule removes. Write the rules down; you will need them when someone asks why the sample shrank from 480 to 452.
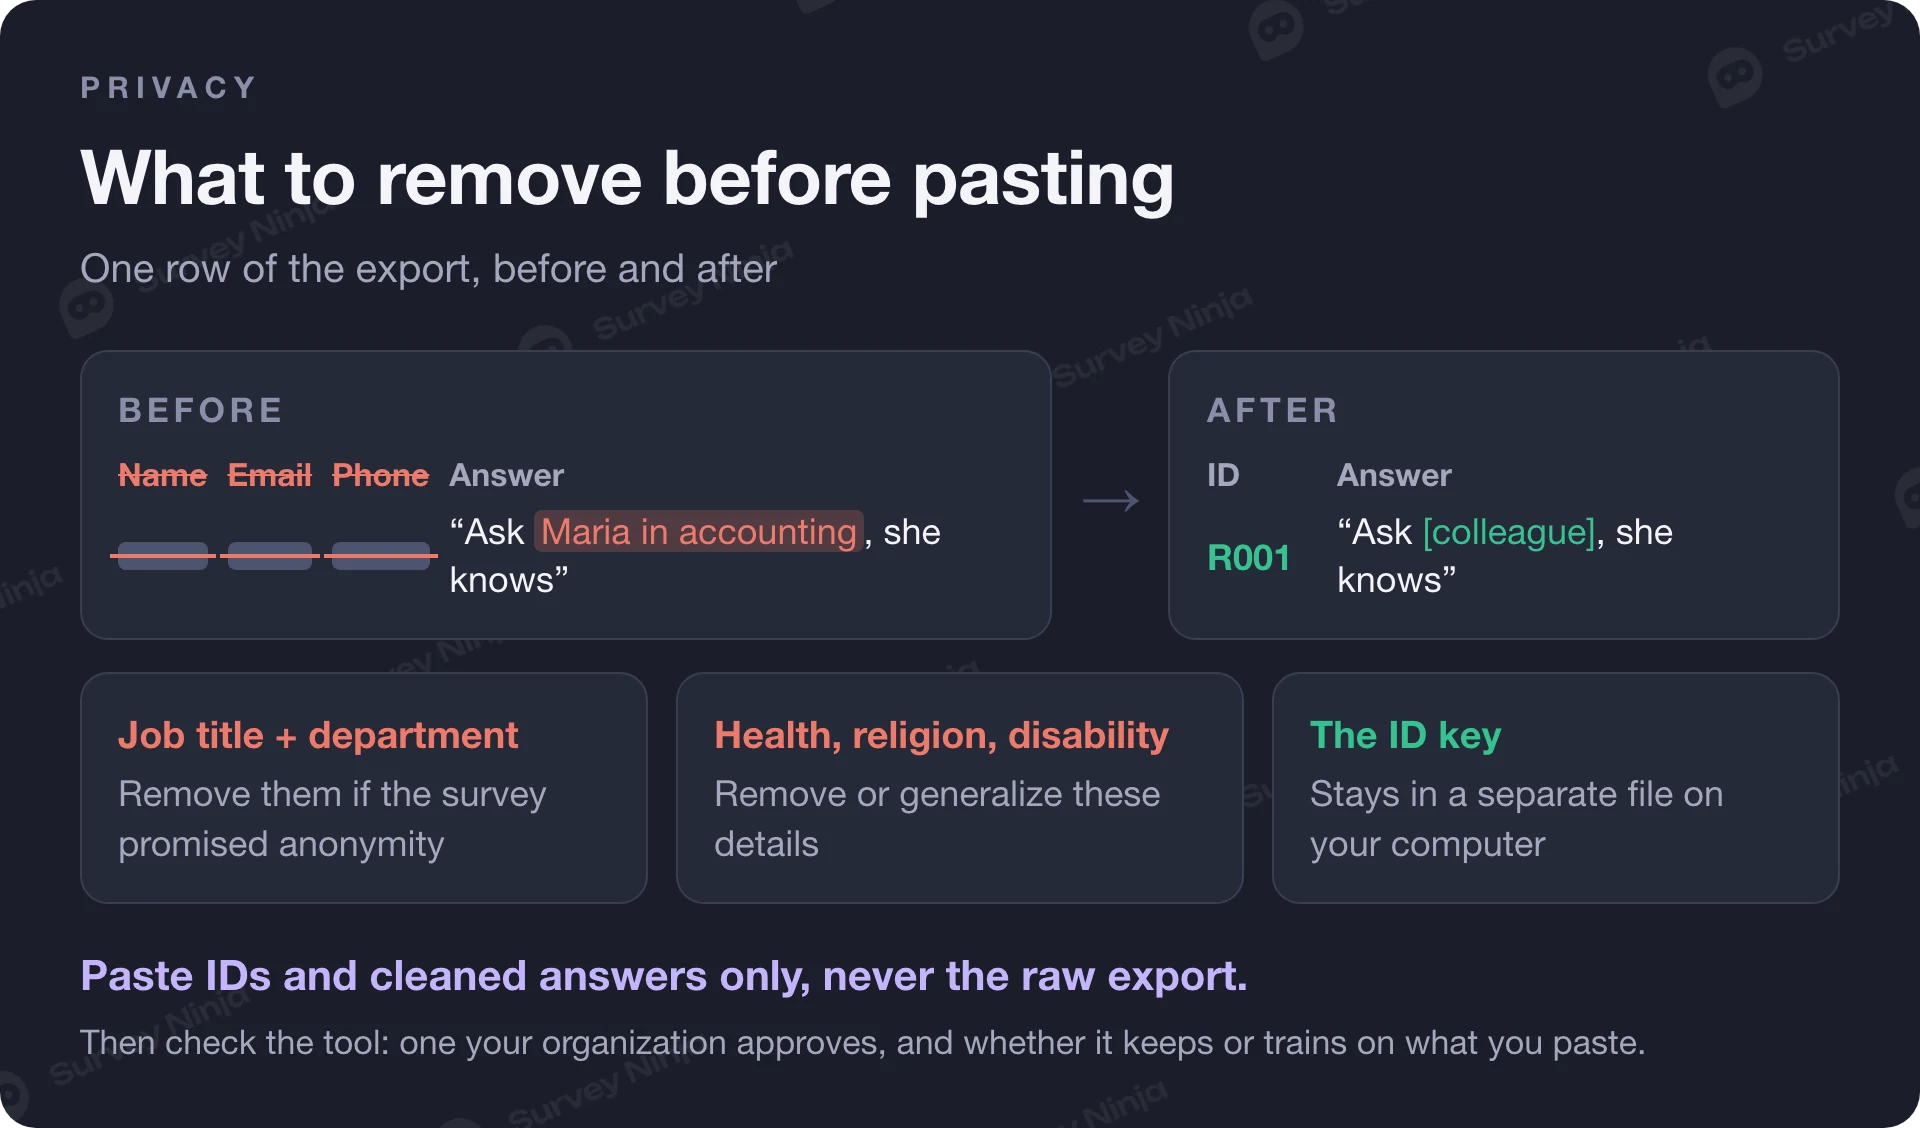
Before any answer goes into an external AI tool, strip personal data. Delete name, email and phone columns. Then search the open answers themselves, because people write things like "Ask Maria in accounting, she knows" or paste an order number. Replace each respondent with an ID (R001, R002…) and keep the key in a separate file that never leaves your computer. In small teams, a job title plus a department can identify someone, so remove those details too if the survey promised anonymity. The same goes for answers that mention health, religion, a disability or similar details: remove or generalize them. For you, as the holder of the ID key, the data is still personal data, so check the tool as well: use one your organization approves, find out whether it keeps what you paste or trains on it, and make sure your privacy notice covers sharing answers with a service like this. Laws such as the GDPR set rules here; check the ones that apply to you.
Step 2: Compute closed questions with formulas
Do the numbers before you touch the text. For each rating or choice question, compute the count, the share of each option, the average and, for scales, the share of top-two-box answers. In a spreadsheet that is COUNTIF, AVERAGE and a pivot table. Our guide to descriptive analysis walks through which statistic fits which question type.
If you plan to compare groups, for example new versus returning customers, compute the averages for each group and the size of the difference. A gap of 0.3 points can matter or not, depending on how spread out the answers are. The effect size calculator turns two means and their spread into Cohen's d, which tells you whether a difference is small, moderate or large. For choosing the right test, see the guide to the statistical treatment of data.
These numbers become the frame for the open answers. When the AI later says "delivery is the main complaint", you will already know how many people rated delivery low and can check whether the two stories agree.
Step 3: Code open answers into themes with AI
Coding means assigning each open-ended answer one or more labels from a fixed list, the codebook. The data coding entry in our glossary covers the terms; the thematic analysis guide covers the manual method. With AI the method stays the same and the speed changes. Work in two passes: first build the codebook from a sample, then apply it to every answer.
Paste answers with their IDs, one per line. If you have more than a few hundred, send them in batches of 100 to 200 and use the same codebook for every batch. The four prompts below are written to be copied as they are. Replace the parts in square brackets.
Prompt 1: Build a codebook from a sample
You are helping me code open-ended survey answers. The question was: "[question text]". Below are [number] answers, each with an ID.<br />Propose a codebook of 6 to 12 themes. For each theme give: a short name, a one-sentence definition, what belongs in it and what does not, and the IDs of 2 answers that are clear examples.<br />Keep themes specific: "late delivery" and "delivery cost" are separate themes, not one "delivery" theme. Add a theme "Other" for answers that fit nothing.<br />Do not count answers and do not give percentages.<br />[answers]
Read the codebook critically. Merge themes that overlap, split themes that mix two problems, and rename anything vague. A good codebook is one a colleague could apply without asking you questions.
Prompt 2: Label every answer
Apply this codebook to each answer below. [paste the final codebook]<br />Return a table with one row per answer and these columns: ID, theme (one or more theme names from the codebook, separated by semicolons), sentiment (positive, negative, mixed or neutral), confidence (high or low).<br />Use only theme names from the codebook. If an answer fits no theme, use "Other". If the answer is empty or meaningless, use "No content".<br />Do not summarize and do not count. Return every ID, in the original order.<br />[answers]
Paste the table back into your spreadsheet next to the original answers. From here on, counting is a formula: COUNTIF on the theme column, or a pivot table of theme by rating.
Prompt 3: Find what the codebook missed
Here are the answers that were coded "Other" or marked low confidence. [answers]<br />Do any of them share a topic that deserves its own theme, even if only a few people mention it? List possible new themes with the IDs that belong to them.<br />Also point out any answer that mentions safety, discrimination, legal problems, billing errors or something similarly serious, even if it is the only one.
Prompt 4: Pull quotes with IDs
For the theme "[theme name]", choose 3 answers that show it most clearly and 1 answer that shows a different side of it.<br />Copy each answer exactly as written, character for character, with its ID. Do not shorten, correct or combine answers. If you cannot find a fitting answer, say so.<br />[answers coded with this theme]
The instruction to copy "character for character" reduces paraphrased quotes, but it does not guarantee them. That is why quotes get their own check in the next step.
Step 4: Check the AI before you trust it
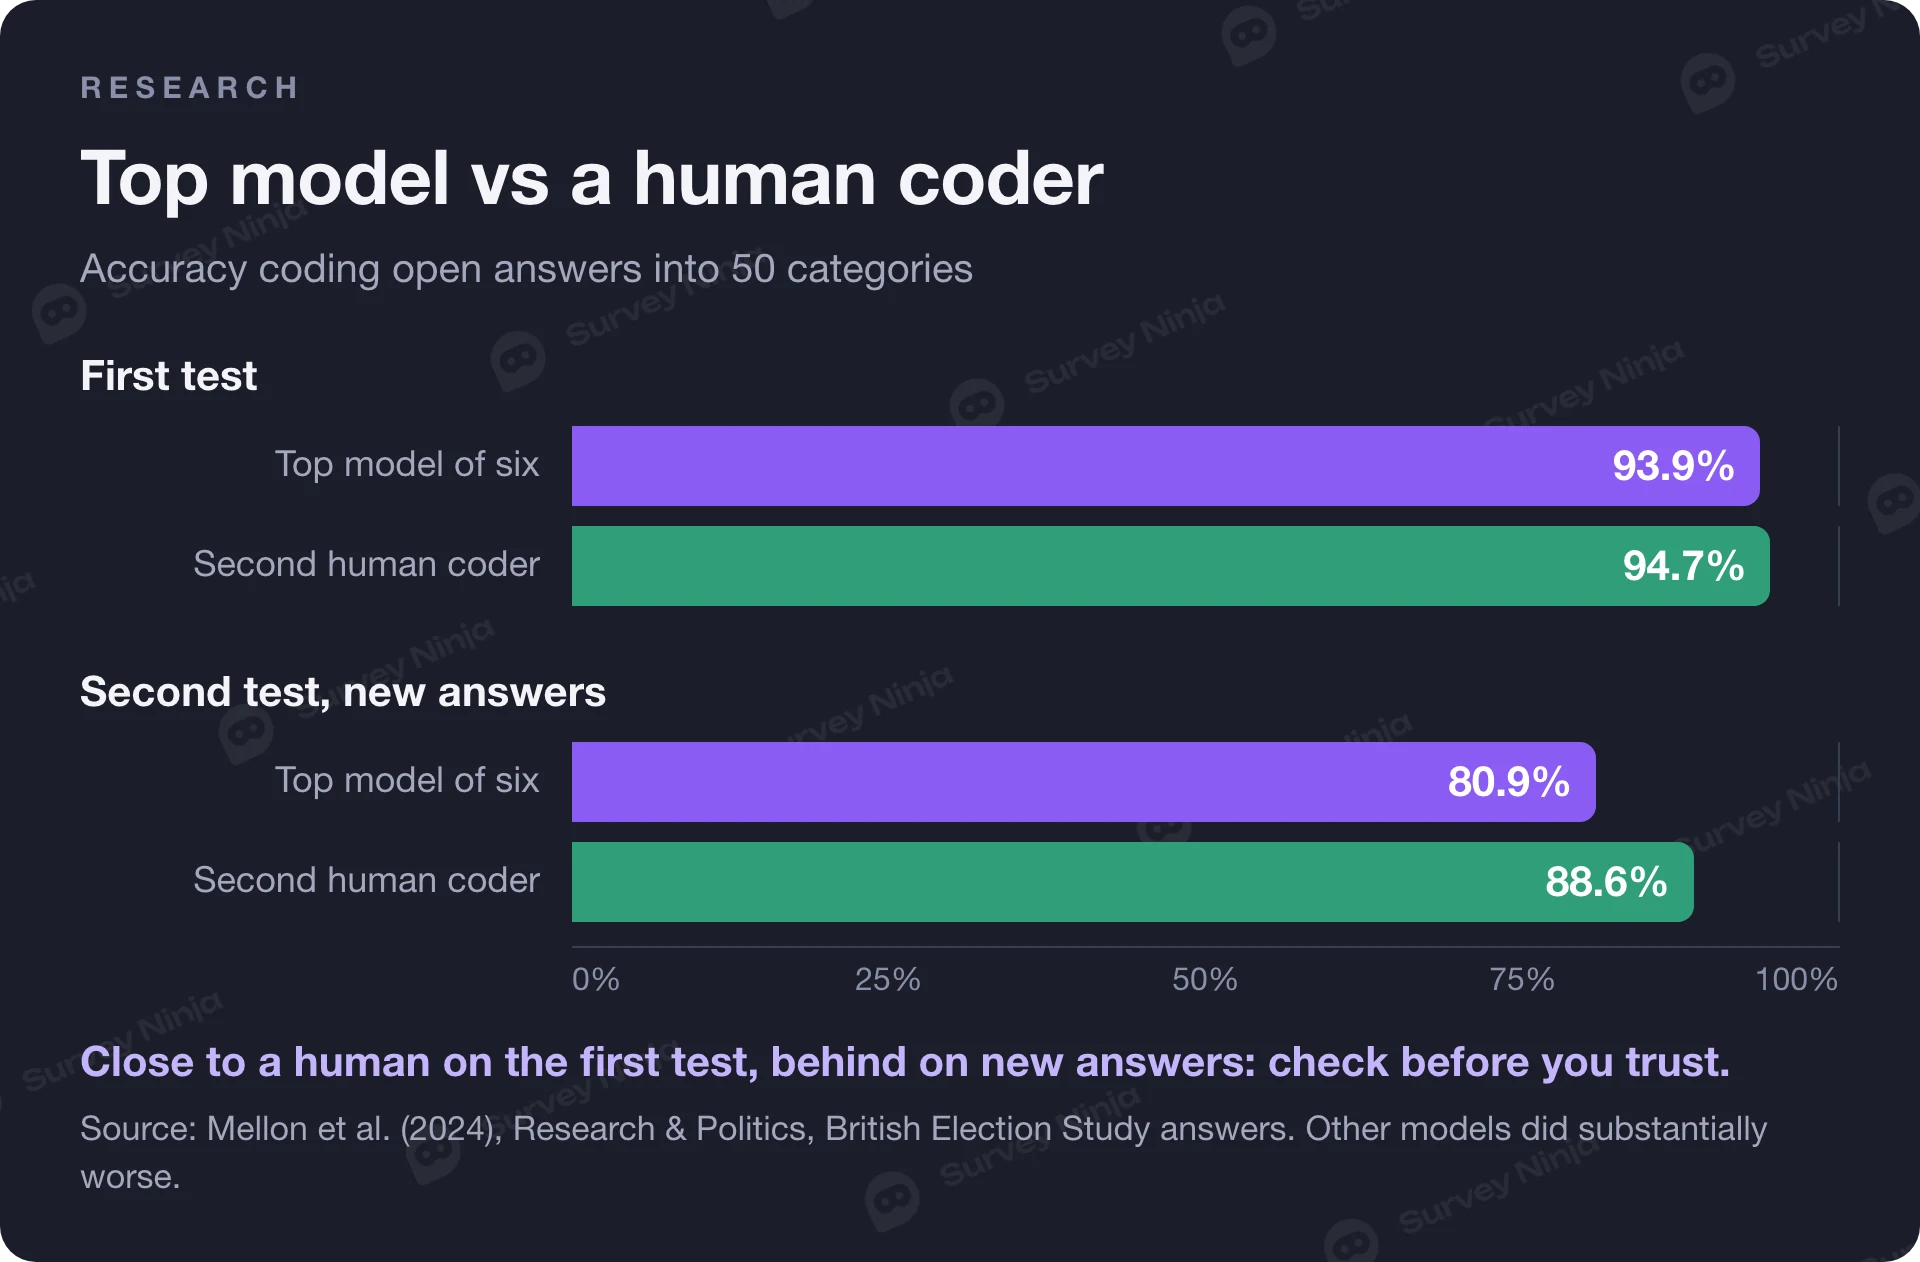
How good are language models at coding survey answers? Well on clear tasks, with large differences between models. In a 2024 study in Research & Politics, Mellon and colleagues asked six language models to sort "most important issue" answers from the British Election Study into 50 categories. The best model came close to a second human coder (93.9% accuracy against 94.7%), while other models did substantially worse. In a second test on new answers the gap grew: 80.9% for the top model against 88.6% for the human. Note the human figure too: two trained people coding the same answers still disagree on some of them. You cannot know which case you are in without checking, and the checks below take about an hour for a survey of a few hundred responses.
| Check | How to run it | Warning sign |
|---|---|---|
| Spot-check a random sample by hand | Pick 40 to 50 coded answers at random (use RAND() and sort). Code them yourself without looking at the AI's labels, then compare. | You disagree on more than about 1 answer in 5. Fix the codebook definitions and run Prompt 2 again. |
| Compare theme counts with a keyword count | For each large theme, count answers that contain its obvious words, for example "late", "delay", "courier" for late delivery. | The two counts differ by a wide margin. Read the answers in the gap to see which side is wrong. |
| Check that every quote exists | Search each quote in the raw export with Ctrl+F or MATCH, using the ID to find the row. | A quote is not found, is shortened, or reads more polished than the original. Replace it with the real text. |
| Cross-check sentiment against the rating | Build a pivot table: the AI's sentiment label against the rating the same person gave on a closed question. | Many "positive" comments from people who rated 1 or 2, or the reverse. Read those rows: sarcasm and mixed answers often hide there. |
| Re-run with a different prompt | Ask for a codebook again with different wording or a different sample of answers, then compare the theme lists. | The main themes change. The data may be too thin or too varied for stable themes, so report them as tentative. |
| Look for minority themes merged away | Read the "Other" bucket and run Prompt 3. Check whether small but serious topics got folded into a broad theme. | "Other" holds more than about 10% of answers, or a complaint about safety or billing sits inside "general dissatisfaction". |
| Never let the model compute percentages | Take labels from the model and count them with formulas. Ignore any percentage the model writes in its summary. | The model's summary says "about 40% mention price" and your count says 19%. Your count wins. |
The thresholds in the table are working rules, not standards. What matters is that you set them before you look at the results, so you are not tempted to accept a codebook because its story is convenient.
A note on sentiment. Sentiment labels are the least stable part of AI coding, because short answers like "fine" or "could be faster" sit between categories. Treat sentiment as a rough sort for reading, and use the closed rating questions when you need a number to report. Our glossary entry on sentiment analysis explains the method and its limits.
Step 5: Write conclusions that hold up
A conclusion that survives questions from a manager has four parts: a number from formulas, a theme with its count, one or two checked quotes, and a limit. Here is how that looks on an example: an online store survey with 480 responses, 452 after cleaning.
| Part | Example | Where it comes from |
|---|---|---|
| Number | 68% rated their last order 4 or 5 out of 5 (307 of 452). | Step 2, COUNTIF |
| Theme with count | Of 391 people who answered "What should we improve?", 118 mentioned late delivery, the largest theme. | Step 3 labels, counted with a pivot table |
| Quote | "The parcel arrived a week after the date on the site and nobody told me." (R214) | Prompt 4, found in the raw data |
| Limit | Customers who never answered the open question are not represented in the theme counts. | Your judgment |
Write theme shares against the number of people who answered the open question, not against all respondents, and say which base you used. When you compare groups, report the effect size you computed in step 2 rather than the model's description of the gap. And keep the codebook, the prompts and the date of the run in an appendix. If someone repeats the analysis next quarter, they can compare like with like. If the survey promised anonymity, leave out any group, count or quote small enough to point to one person.
Common mistakes in AI survey analysis
- Pasting the whole export, closed questions included, and asking the model for "insights". You get prose with numbers you cannot trace.
- Letting the model count themes or compute shares instead of counting its labels with formulas.
- Skipping the codebook and asking for themes in one step, so each batch ends up with a different list.
- Reporting quotes without searching for them in the raw data.
- Treating "Other" as noise. Small groups often say the most specific things.
- Pasting names, emails or identifying details into an external tool.
- Presenting AI themes from 30 answers with the same confidence as themes from 3,000.
How to analyze survey data with AI in SurveyNinja
If you only need themes from a set of open answers, paste them into the free AI Survey Summary. It groups the answers into themes, separates positive and negative signals and suggests actions, and it works without an account. Remove personal data first, as in step 1, and use the summary as a first codebook that you then check.
For surveys you run in SurveyNinja, the AI report (Smart Analytics, Beta) on Premium and Enterprise builds the analysis from your responses once a survey has at least 5 completed ones. It has three sections: text analysis of open answers, a group comparison of the two largest groups with the size of the difference measured by Cohen's d, and a quantitative section for closed questions. Averages and distributions in the report are computed by code, which is the split this guide recommends. Sentiment of open answers is estimated by the model, so the sentiment check from step 4 is still worth a few minutes. With few responses, read the report as a first look: a comparison of two groups of five people is a hint, not a finding. Step 1 starts earlier here, at the design stage: if the survey does not need names or contacts, do not ask for them. You can share the report as a PDF or a public link. Responses also export to CSV and XLSX for the formula work in step 2.
Frequently asked questions
Can AI analyze survey data?
Yes, with a division of labor. AI is good at reading open-ended answers, proposing themes and labeling each answer. Averages, percentages and group differences should come from formulas or code, because a language model can return numbers that look plausible and are wrong. Check the AI's coding against a hand-coded sample before you report it.
How do you analyze open-ended survey responses with AI?
Remove personal data, then ask the model to propose a codebook from a sample of answers. Edit the codebook, have the model label every answer with a theme and sentiment, and count the labels with spreadsheet formulas. Finish by spot-checking a random sample by hand and confirming that every quote you plan to use exists in the data.
Should AI calculate survey percentages?
No. Ask the model for a label per answer and count those labels yourself with COUNTIF or a pivot table. Language models generate numbers as text, so a percentage in a summary can be off by a wide margin without any sign of it. Formulas give the same correct result every time and can be checked by anyone.
How do I check AI survey analysis for errors?
Code 40 to 50 random answers yourself and compare them with the AI's labels. Compare theme counts with a simple keyword count, search every quote in the raw data, and check sentiment against the rating each person gave. Re-run the coding with a different prompt and read the "Other" bucket for small themes that were merged away.
Is it safe to paste survey responses into an AI tool?
Only after you remove personal data, and only in a tool your organization approves. Delete names, emails, phone numbers and order numbers, replace respondents with IDs, and search open answers for names or details that identify someone. Check whether the tool keeps what you paste or trains on it. If the survey promised anonymity, also remove job titles and other details that could point to one person.
How many responses do you need for AI survey analysis?
There is no fixed minimum for coding, but themes become more stable as answers grow. With a few dozen answers you can read everything yourself and use AI only to speed up labeling. With hundreds, AI saves the most time. SurveyNinja's AI report, on Premium and Enterprise, starts working from 5 completed responses; with that few, treat it as a first look.
Published: Nov 13, 2026