 Google Forms Limits: Responses, File Uploads, Timers and Logic, With Workarounds
Non-Probability Sampling: Types, Examples and When to Use Each
Research methods  Mike Taylor Nov 18, 2026 Reading time ≈ 18 min
Contents
- What is non-probability sampling?
- Probability vs non-probability sampling
- Types of non-probability sampling
- Which non-probability sampling method should you use?
- Worked example: convenience vs quota sampling on the same survey
- What you can and cannot claim from a non-probability sample
- How to describe non-probability sampling in your methodology
- How to reduce bias in a non-probability sample
- How to run a non-probability survey in SurveyNinja
- Frequently asked questions

Non-probability sampling is a way of choosing survey participants in which the researcher or the respondents themselves decide who takes part, so nobody has a known chance of being selected. The five common types are convenience, purposive, quota, snowball and voluntary response sampling. Below you will find each type with an online survey example, how it differs from probability sampling, what the results can support and a template for your methodology chapter.
This guide is the companion to our article on probability sampling, which covers random, systematic, stratified and cluster designs. Here we cover the samples most students, product teams and nonprofits actually run.
Key points
- In non-probability sampling, people get into the sample because they are easy to reach, chosen by the researcher, referred by others or volunteer, so their chance of selection is unknown.
- Convenience, purposive, quota, snowball and voluntary response sampling each fit a different goal, and each brings its own selection bias.
- A margin of error has no meaning for these samples: describe the people who answered and avoid claims about the whole population.
- Quotas on two or three key variables and a transparent methods section make a non-probability survey far easier to defend.
What is non-probability sampling?
Non-probability sampling is any selection method where inclusion depends on judgment, access or self-selection rather than a random draw from a list of the whole population. Because the probability of selection is unknown, the usual sampling error cannot be computed.
In a probability sample you start from a full list of the population, such as every enrolled student or every customer in the CRM, and a random process decides who is invited. In a non-probability sample there is often no complete list at all. You post a link in a Facebook group, ask colleagues to forward it or pick ten experts you trust. The answers are valid data about the people who gave them. The open question is how far those people resemble everyone else.
That question has a long history. In 1948 the three leading US pollsters, Crossley, Gallup and Roper, all used quota sampling and all predicted that Thomas Dewey would beat Harry Truman. The 2013 AAPOR task force report on non-probability sampling recounts that interviewers filling their quotas tended to pick more educated and better-off people, which biased the samples against Truman. Gallup moved to probability methods soon after, yet quota and other non-probability methods remain standard in market research, qualitative studies and most student theses.
Probability vs non-probability sampling
The difference is who decides who gets in. In probability sampling a random process decides, so you can measure how far results may drift from the population. In non-probability sampling a person decides, and you trade that measurable precision for speed, lower cost and access to groups without a list.
| Question | Probability sampling | Non-probability sampling |
|---|---|---|
| Who decides who is selected | A random process | The researcher, a referral chain or the respondent |
| Chance of selection | Known and above zero for everyone on the list | Unknown, and zero for people the method cannot reach |
| Needs a full list (sampling frame) | Yes | No |
| Margin of error | Can be calculated | Not meaningful |
| Generalizing to the population | Yes, within the margin of error | Only with strong assumptions, stated openly |
| Cost and time | Higher | Lower |
| Typical uses | Official statistics, prevalence estimates, academic surveys that need inference | Exploratory studies, pilots, qualitative research, hard-to-reach groups, quick feedback |
Neither family is better in general. A national unemployment rate needs a probability sample. Ten interviews with hospital pharmacists about a new ordering system need a purposive one. The mistake is writing up a non-probability sample as if it were a probability one.
Types of non-probability sampling
Textbooks list four main types (convenience, purposive, quota and snowball), and online surveys made voluntary response sampling a common fifth. Each comes with an online survey example, when it fits and which bias to watch.
Convenience sampling
Convenience sampling means surveying whoever is easiest to reach: your classmates, your newsletter subscribers, visitors to one page of your website. It is also called accidental sampling.
Example: a master's student studying sleep habits of university students shares the survey link in three WhatsApp groups from her own program and gets 180 responses in two days.
When it fits: pilot testing a questionnaire, exploring a topic before a larger study, or a class project. Main risk: the sample mirrors your own network. Her respondents share a subject and a timetable, so their sleep may differ from students in other programs.
A stricter variant is consecutive sampling: you include every eligible person who comes along during a set period, such as every customer who contacts support in March or every patient seen at a clinic in one month. It removes the researcher's choice of whom to ask, but the period and the place still decide who can be included.
Purposive (judgmental) sampling
In purposive sampling, also called judgmental or expert sampling, the researcher deliberately chooses people who have the knowledge or experience the study needs. The criteria are written before recruitment.
Example: a team evaluating a school feeding program surveys the 12 school principals and 25 kitchen coordinators who ran it in its first year, because nobody else saw how it worked day to day.
When it fits: expert panels, qualitative interviews, case studies, and surveys of a small, known group with specific experience. Variants include typical cases, extreme cases and maximum variation. Main risk: the researcher's judgment. Pick only the principals who liked the program and it will look better than it was. Write the criteria down and apply them to everyone who meets them.
Quota sampling
Quota sampling sets target numbers for groups so that the sample matches the population on a few known characteristics, such as gender, age band or region. Within each group, people are still recruited by convenience until the quota is full.
Example: a regional bank knows that 55% of its customers are 18 to 44 and 45% are older. For 400 responses it sets quotas of 220 and 180 and closes each group when it is full.
When it fits: market research, opinion surveys without a contact list, and theses that need a sample resembling the population on a few key variables. Main risk: quotas fix the mix only on the variables you set. Inside each quota cell, the people who answer first are the easiest to reach, which is exactly what went wrong in 1948. Plan targets with the quotas planner and track fieldwork with the quota progress calculator.
Snowball sampling
In snowball sampling the first participants recruit the next ones from their own contacts, and the sample grows wave by wave. It is the standard approach for groups that have no list or would not answer a stranger.
Example: a researcher studying freelance sign language interpreters starts with six interpreters she knows. At the end of the survey each one is asked to forward the link to colleagues, and after three waves the sample reaches 140 people.
The method has formal roots. Leo Goodman described snowball sampling as a statistical procedure in a 1961 paper in The Annals of Mathematical Statistics, and Douglas Heckathorn later developed respondent-driven sampling (1997), which tracks who recruited whom and limits referrals per person so estimates can be adjusted. When it fits: rare or hidden groups, sensitive topics, professional niches. Main risk: people refer others like themselves, so well-connected members are overrepresented and isolated ones are missed. Ask participants to forward the link rather than send you other people's contacts.
Voluntary response (self-selection) sampling
In voluntary response sampling the survey is open and people decide on their own to take part: a link on social media, a pop-up on a website, an open poll.
Example: a city council posts a survey about a new bike lane on its social media accounts and receives 2,300 answers in a week, mostly from daily cyclists and from people opposed to losing parking.
When it fits: collecting ideas and complaints, testing interest, reaching people who care about a topic. Main risk: people with strong opinions answer more, and open links attract respondents who are not who they claim to be. In a 2022 Pew Research Center experiment with online opt-in samples, where people sign up on their own, 12% of adults under 30 said they were licensed to operate a nuclear submarine, a license that practically no American holds.
As Pew explained in a 2024 analysis, a likely cause is bogus respondents who answer insincerely, and the problem was concentrated among young adults. For a voluntary survey, check answers for impossible claims and report results as the views of people who chose to answer.
Which non-probability sampling method should you use?
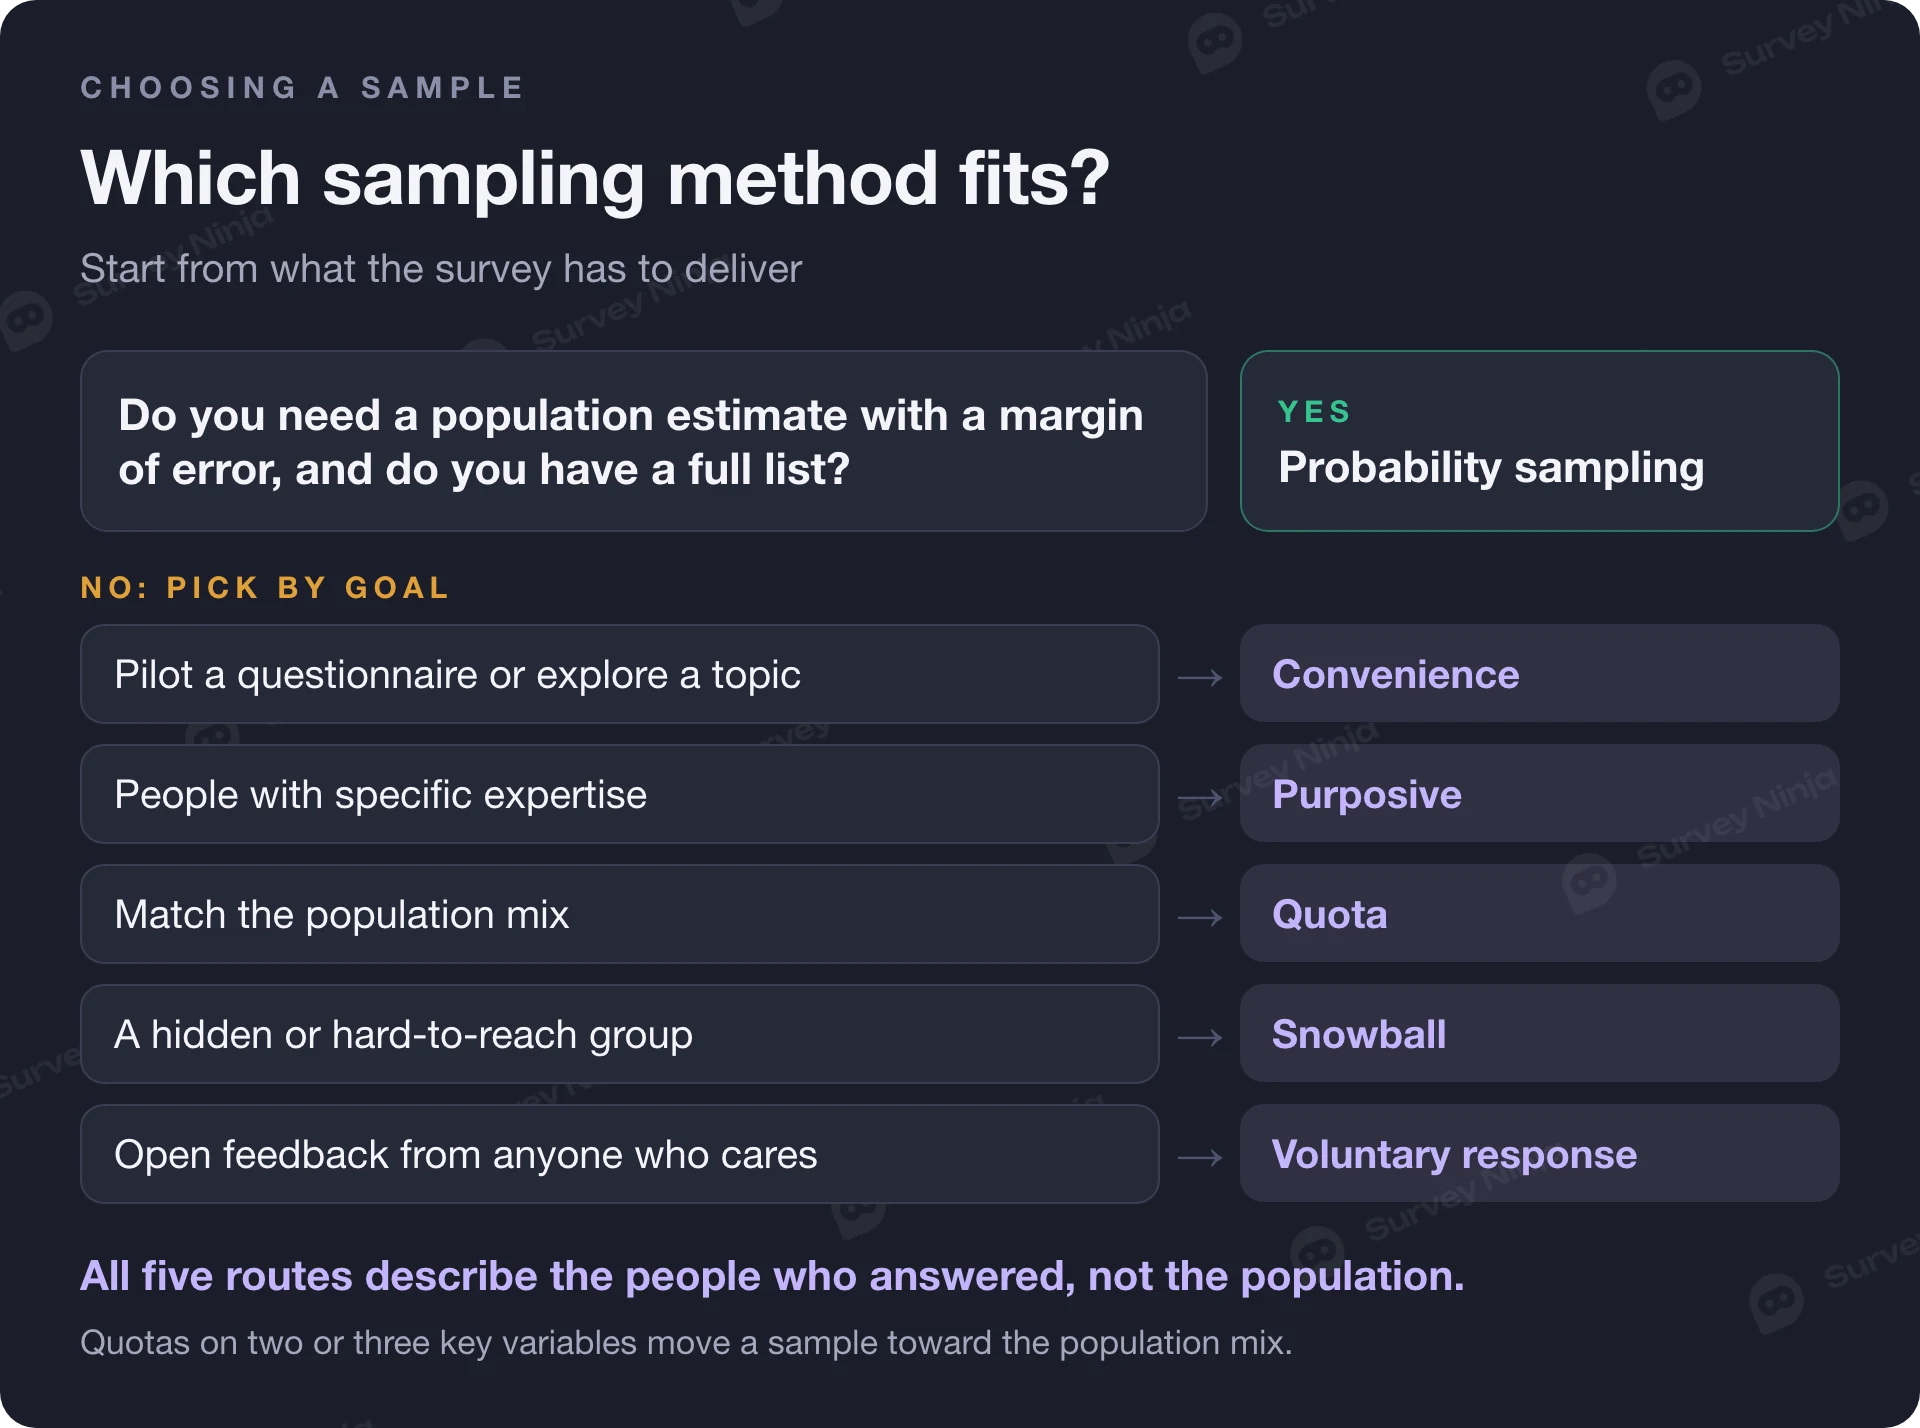
Pick the method from your research question, not from what is fastest. If you need an estimate for a whole population with a margin of error and you have a list, use a probability design. Otherwise, start from your goal: testing a questionnaire points to convenience, specific expertise to purposive, a population mix to quota, a hidden group to snowball, and open feedback to voluntary response.
Worked example: convenience vs quota sampling on the same survey
A quota on one key variable can move an estimate by several points. Here is an illustration with example data.
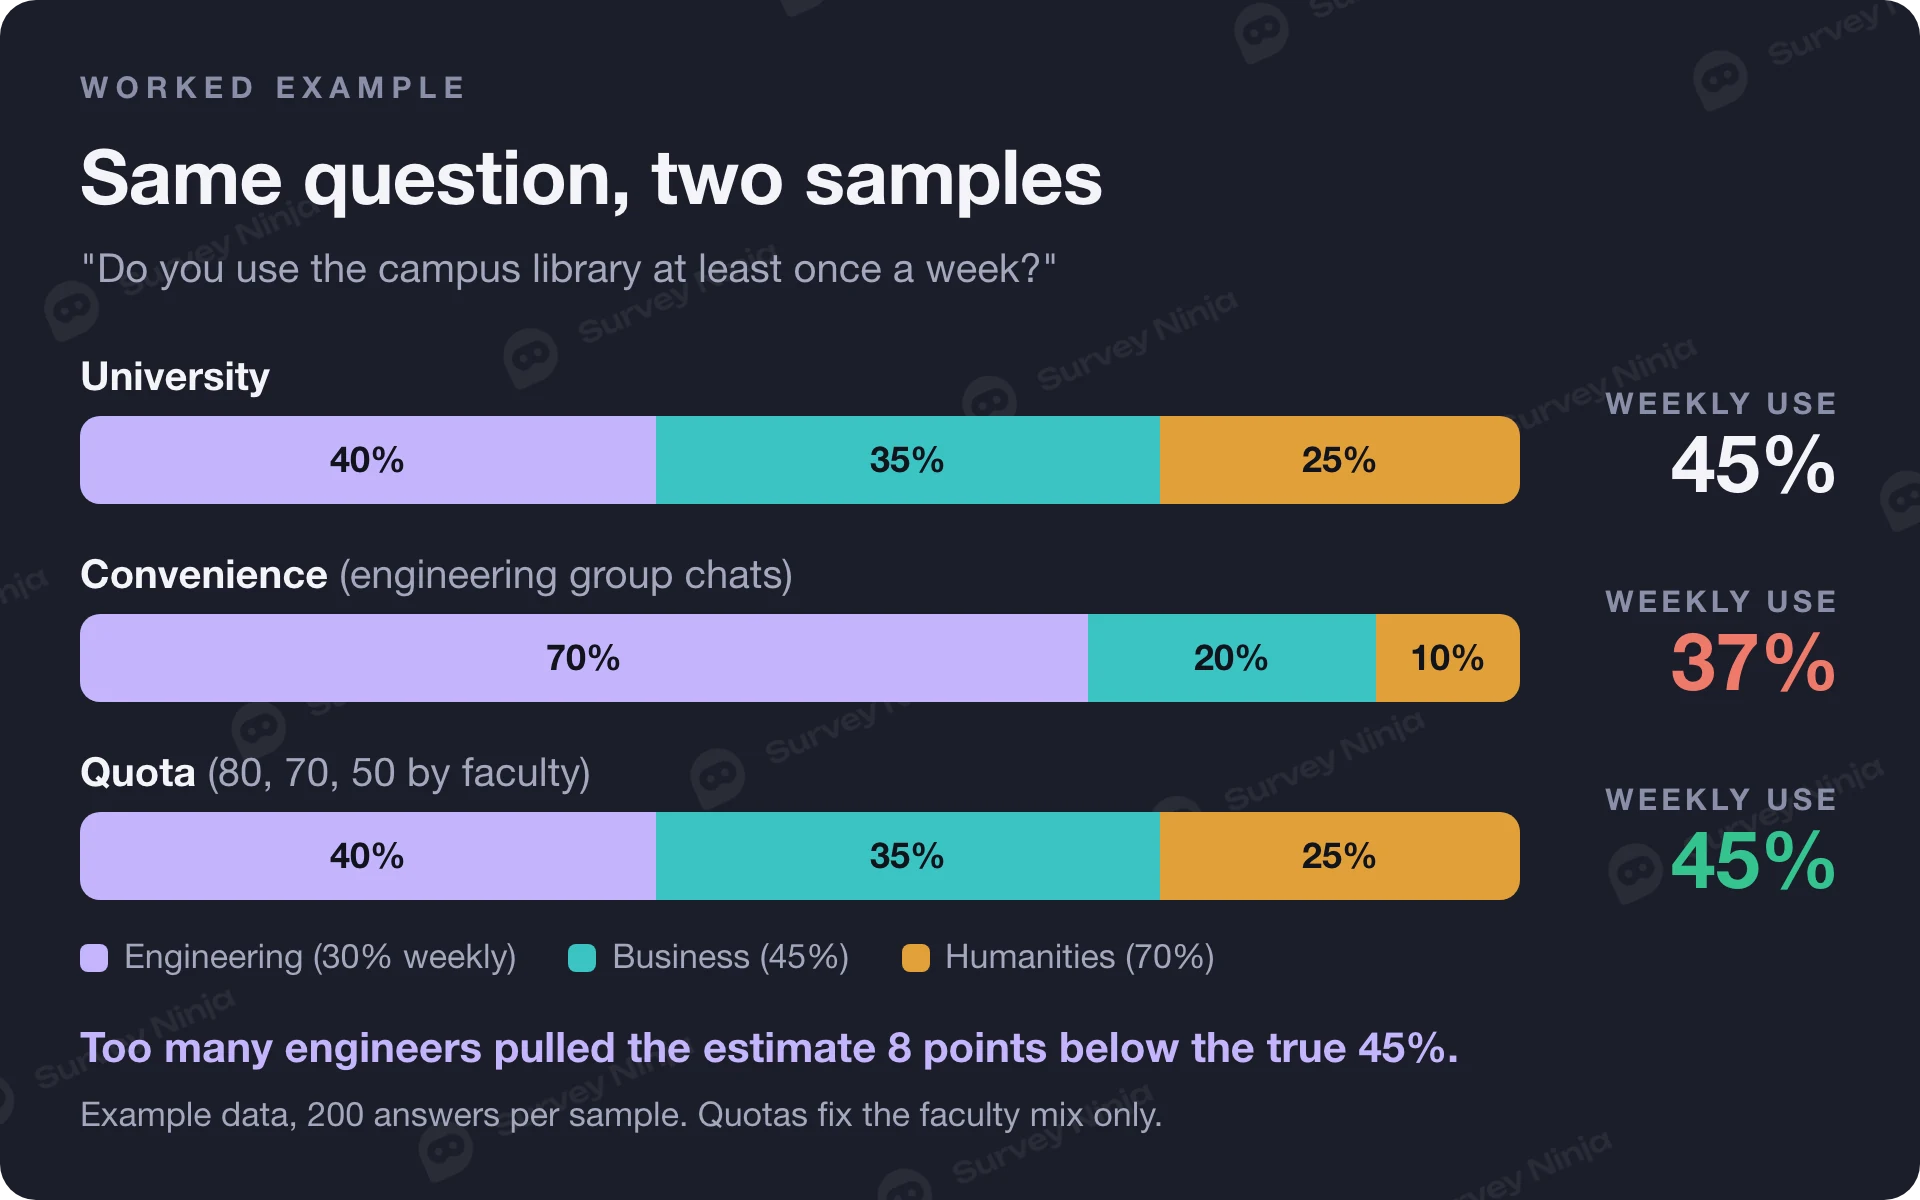
A university has 8,000 students: 40% in engineering, 35% in business and 25% in humanities. A student asks, "Do you use the campus library at least once a week?" Suppose the true weekly share is 30% in engineering, 45% in business and 70% in humanities, which gives about 45% across the university.
The student collects 200 answers in two ways: a convenience sample, with the link shared in their engineering groups, and a quota sample by faculty, with 80, 70 and 50 answers. The table shows each faculty's share of the answers and the estimate each sample gives.
| Faculty (% of students) | Convenience | Quota |
|---|---|---|
| Engineering (40%) | 70% | 40% |
| Business (35%) | 20% | 35% |
| Humanities (25%) | 10% | 25% |
| Estimated weekly library use | 37% | 45% |
The convenience sample overrepresents engineers, who use the library least, so it reports 37%: an 8-point error that would not shrink with 2,000 answers from the same groups. The quota sample matches the faculty mix and lands on 45%. In the convenience sample: (140 × 0.30 + 40 × 0.45 + 20 × 0.70) ÷ 200 = 37%.
The quota result is only as good as the assumption behind it. Here it works because the example assumes that respondents in each faculty use the library like their faculty as a whole. Post the link on a library noticeboard and every quota cell fills with regulars. That is why a quota sample is still a non-probability sample.
What you can and cannot claim from a non-probability sample
You can describe the people who answered, find patterns and compare groups inside the sample with care. You cannot attach a margin of error or present percentages as facts about the population. AAPOR has long held that reporting margin of sampling error with opt-in or self-identified samples is misleading
.
- Describe the sample: "Of the 212 students who responded, 64% sleep less than seven hours on weekdays."
- Report patterns and differences within the sample, with the group sizes next to each percentage.
- Use the results to generate hypotheses for a later study.
- Compare your sample with known population figures (age, gender, faculty) and state where it differs.
- Do not write "64% of university students sleep less than seven hours."
- Do not report a margin of error or "±5% at 95% confidence" for the whole population.
- Do not call the sample representative because it is large.
Sample size still matters. A sample size calculator tells you how many answers a probability sample needs for a given precision, and many supervisors ask non-probability studies to reach a similar number. Report it as a target, not as proof of precision. Weighting the sample toward the population helps on the weighted variables and cannot fix bias on the others.
How to describe non-probability sampling in your methodology
The methods section (chapter 3 in many theses) should let a reader judge who your respondents represent. AAPOR's task force concluded that non-probability studies carry a higher burden of transparency than probability ones, so describe the recruitment in more detail, not less. Our guide to the respondents of the study section covers the whole chapter. The sampling paragraph should include:
- The target population (place, time, criteria).
- The sampling method by name and why it fits the research question.
- Recruitment channels, dates, reminders and incentives.
- Inclusion and exclusion criteria, and the screening question that applied them.
- Quota targets and the numbers achieved, if you used quotas.
- Valid responses, and how many were removed and why.
- Limitations: which groups are likely over- or underrepresented.
Template paragraph for a methods section
"The study used non-probability quota sampling. The target population was undergraduate students enrolled at [university] in [semester, year]. Quotas by faculty matched official enrollment (engineering 40%, business 35%, humanities 25%). The online questionnaire was distributed from [date] to [date] through faculty mailing lists and student group chats, with one reminder after seven days. A screening question confirmed current enrollment. Of 236 responses received, 200 were complete and valid. Because participants were not selected at random, the results describe the students who took part and cannot be generalized to all students with a known margin of error."
Name the method precisely. If you shared a link and accepted whoever answered, the sample is convenience or voluntary, not "random", however many people responded.
How to reduce bias in a non-probability sample
You cannot remove selection bias from a non-probability sample, but you can make it smaller and visible. Most of the work happens before the link goes out.
- Define the population first, then choose channels that reach it.
- Use several channels: three different groups or lists bring more variety than one large one.
- Set quotas on two or three variables known in the population and likely to affect answers, such as age band and region.
- Screen at the start, record the source of every response and compare the final sample with known population figures.
Wording and response biases add to the sampling problem. Our overview of survey bias covers them with a checklist by stage.
How to run a non-probability survey in SurveyNinja
Quotas and screen-out logic are on every plan, including Free. Quotas set a target per group, such as 80 engineering, 70 business and 50 humanities students. Screen-out logic ends the survey for people outside your inclusion criteria.
- Plan Work out the total with the sample size calculator and split it into groups with the quotas planner.
- Build Create the survey, add a screening question with screen-out logic and a quota for each group.
- Tag channels From the Basic plan, add a hidden variable to the link (for example ?source=whatsapp) so every response records where it came from.
- Track Check fill rates during fieldwork with the quota progress calculator and send reminders to the channels that lag behind.
- Export Download the data as CSV, XLSX or SPSS on any plan for analysis.
Frequently asked questions
What is non-probability sampling?
Non-probability sampling is a method of selecting participants in which the researcher's judgment, ease of access, referrals or self-selection decide who takes part, rather than a random draw. Because each person's chance of selection is unknown, the results describe the respondents and cannot be generalized with a margin of error.
What are the 4 types of non-probability sampling?
The four main types are convenience sampling (people who are easy to reach), purposive or judgmental sampling (people chosen for their knowledge or experience), quota sampling (target numbers per group, filled non-randomly) and snowball sampling (participants recruit others). Many sources add voluntary response sampling, where people choose to answer an open survey.
What is the difference between probability and non-probability sampling?
In probability sampling a random process selects people from a list, so everyone has a known chance of being chosen and the margin of error can be calculated. In non-probability sampling people are selected by judgment, access or self-selection, so their chance is unknown. Its results apply only to the respondents.
Is convenience sampling qualitative or quantitative?
Convenience sampling is used in both. Qualitative studies use it to find people for interviews, and quantitative studies use it for pilots, class projects and exploratory surveys. In quantitative work you can report percentages for your respondents, but not population estimates with a margin of error.
Can you calculate a margin of error for a non-probability sample?
Not in the usual sense. The standard margin of error assumes a random sample from the population, which a non-probability sample does not provide. AAPOR considers reporting one for opt-in or self-selected samples misleading. Report the sample size and composition instead, and present results as findings about the participants.
What is the difference between quota sampling and stratified sampling?
Both divide the population into groups such as age bands or regions and set a number for each group. Stratified sampling then selects people at random from a list of each group, so it is a probability method. Quota sampling accepts whoever is available until each quota is full, so it remains a non-probability method.
Published: Nov 18, 2026