 Google Forms Limits: Responses, File Uploads, Timers and Logic, With Workarounds
Data Collection Methods in Research: Techniques, Instruments and How to Choose
Research methods  Mike Taylor Nov 19, 2026 Reading time ≈ 19 min
Contents
- What are data collection methods?
- Technique vs research instrument: what's the difference?
- Primary and secondary data collection
- Qualitative, quantitative and mixed data collection methods
- The main data collection techniques and their instruments
- Interviewer or self-administered: why the mode changes the answers
- How to choose a data collection method for your research question
- How to describe your research instrument in the methodology
- How to collect survey data in SurveyNinja
- Frequently asked questions
Data collection methods are the techniques a researcher uses to gather the information that answers a research question, such as surveys, interviews, observation, focus groups, document analysis and experiments. Each technique works through a research instrument: a survey uses a questionnaire, an interview uses an interview guide. This guide shows which pairs exist, how to choose one and how to describe it in a thesis.
Students often lose marks here by writing "the technique used was the questionnaire" or by listing five methods without saying why. Both are easy to fix.
Key points
- A data collection technique is the procedure (survey, interview, observation), and a research instrument is the concrete tool that carries it out (questionnaire, interview guide, checklist).
- Choose the method from the research question: surveys measure how common something is, interviews and focus groups explain why, observation shows what people do, documents show what is already recorded.
- The mode matters too: in a Pew Research Center experiment, 62% said they were very satisfied with family life on the phone and 44% on the web.
- In the methodology, name the technique and the instrument, its origin, structure, validation, pilot and how it was administered.
What are data collection methods?
Data collection methods are the planned ways of getting the information your study needs, from people or from records. They sit between the research design and the analysis: the design says what you want to know and from whom, the method says how you will get it, and the analysis says what you will do with it.
Three words get mixed up in methodology chapters, so it helps to fix them early:
- Method is the broad approach, usually qualitative, quantitative or mixed.
- Technique is the procedure you use to collect data within that approach: a survey, an interview, observation.
- Instrument is the concrete tool you build or adapt to apply the technique: the questionnaire, the interview guide, the observation checklist. A research instrument is the thing you can attach as an appendix.
A national census shows the split clearly. In the 2020 United States census, households could answer one questionnaire online, on paper or by phone. According to the US Census Bureau (2021), 79.74% of households that responded on their own did so online, 18.13% mailed a paper form and 2.13% answered by phone. The technique was a self-administered survey, the instrument was the census questionnaire, and the three channels were modes of administering the same instrument.
Technique vs research instrument: what's the difference?
The technique is how you collect data, and the research instrument is what you collect it with. A survey is a technique and a questionnaire is its instrument. So the answer to the common exam question "is a questionnaire a technique or an instrument?" is: an instrument, used in the survey technique (and sometimes in a structured interview, where an interviewer reads the questionnaire aloud).
| Technique and instrument | What you get, and when to choose it |
|---|---|
| Survey. Questionnaire (online, paper or read by an interviewer) | Comparable answers from many people, mostly numbers. Choose it when you need to know how common an opinion or behavior is, or compare groups. |
| Interview. Interview guide or protocol | Detailed accounts in the person's own words. Choose it when you need to understand reasons, experiences or decisions. |
| Focus group. Discussion guide with prompts and activities | How a group talks about a topic, shared and conflicting views. Choose it when you want language, reactions to concepts, or ideas for a questionnaire. |
| Observation. Observation checklist, coding grid or field notes | What people actually do, in context. Choose it when self-reports would be unreliable, or behavior is the variable. |
| Document analysis. Coding sheet or data extraction form | Data from records, reports, posts or archives. Choose it when the information already exists, or you study how something was written. |
| Experiment. Protocol plus measurement tools (test, scale, questionnaire) | Differences between conditions you control. Choose it when you need to test whether A causes a change in B. |
| Test or scale. Standardized test, validated scale | A score for knowledge, ability or an attitude. Choose it when a validated measure for your construct already exists. |
One technique can use several instruments: an experiment measures its outcome with a questionnaire or a test, and ethnographic research combines observation, informal interviews and documents in one field project.
Primary and secondary data collection
Primary data is collected by you for your study, and secondary data was collected earlier by someone else for another purpose. Surveys, interviews, focus groups, observation and experiments produce primary data. Statistics office tables, company records, published datasets and earlier studies are secondary sources.
Most projects start with secondary data, which is cheaper and shows what is already known, then collect primary data to fill the gap. Our guide to primary vs secondary research covers how to combine them. Describe how you selected and extracted secondary data with the same care as a questionnaire.
Qualitative, quantitative and mixed data collection methods
Quantitative data collection methods produce numbers you can count and compare: closed survey questions, rating scales, tests, structured observation, experiments. Qualitative methods produce words, images and observations you interpret: in-depth interviews, focus groups, open observation, document analysis.
Several techniques can go either way. A questionnaire with open questions collects qualitative data; observation with a coding grid collects counts. The instrument decides: how structured it is and whether answers are fixed in advance.
Mixed methods combine both, usually in sequence: interviews first to write a better survey (exploratory), or a survey first and interviews to explain a surprising result (explanatory). Checking one finding with two methods is called triangulation.
The main data collection techniques and their instruments
Six techniques cover almost every research project. For each: what it collects, its instrument and where it goes wrong.
Surveys and questionnaires
A survey asks many people the same questions in the same order, so the answers can be counted and compared between groups. Its instrument is the questionnaire, explained in detail in our article on what a questionnaire is. Surveys fit research questions with "how many", "how often" or "is there a difference between". They are weak at explaining reasons: the answer "price" says that price mattered, not what about it. Quality depends on question wording and on who answers, so questionnaire design and sampling deserve as much time as building the form.
Interviews
An interview is a conversation in which the researcher asks one person questions and follows up on the answers. Its instrument is the interview guide: the opening, the main questions, follow-up prompts and the close. Interviews range from structured (fixed wording) through semi-structured (fixed topics, free follow-ups) to unstructured (one broad opening question). For a fairly similar group of people, Guest, Bunce and Johnson (2006) found that the main themes appeared within the first 12 of 60 interviews they analyzed. Treat that as a starting point and stop when new interviews stop adding new themes.
Focus groups
A focus group brings six to ten people together with a moderator to discuss a topic. The instrument is a discussion guide with questions, prompts and sometimes tasks, such as sorting concepts or reacting to a prototype. They show the words people use and how opinions shift when others speak, which helps before writing a questionnaire. They are a poor fit for sensitive topics and for counting, because the loudest participant can set the tone.
Observation
Observation records what people do instead of what they say they do. Structured observation uses a checklist or coding grid with predefined categories and produces counts; unstructured observation uses field notes. The researcher can take part in the setting (participant observation) or stay outside it. Use it when self-reports are unreliable, such as time spent on a task or how customers move through a store. It needs consent or a clear legal basis whenever people can be identified.
Document and records analysis
Document analysis collects data from material that already exists: reports, policies, minutes, medical or school records, news articles, social media posts. The instrument is a coding sheet or extraction form that lists exactly which fields you record from each document and how you code them. Digital traces, such as usage logs of a platform or website analytics, belong here too when you have permission to use them. It is cheap and unobtrusive, but you depend on how the records were kept.
Experiments
An experiment changes one factor on purpose and measures the effect, ideally with random assignment of participants to conditions. The instrument is the protocol (what each group sees and in which order) plus the measurement tool for the outcome, often a questionnaire or a test. Online, the simplest version is a split test of two question wordings.
Interviewer or self-administered: why the mode changes the answers
The same question can produce different answers depending on whether a person or a screen asks it. This mode effect is strongest for personal and sensitive questions, where people want to look good in front of an interviewer.
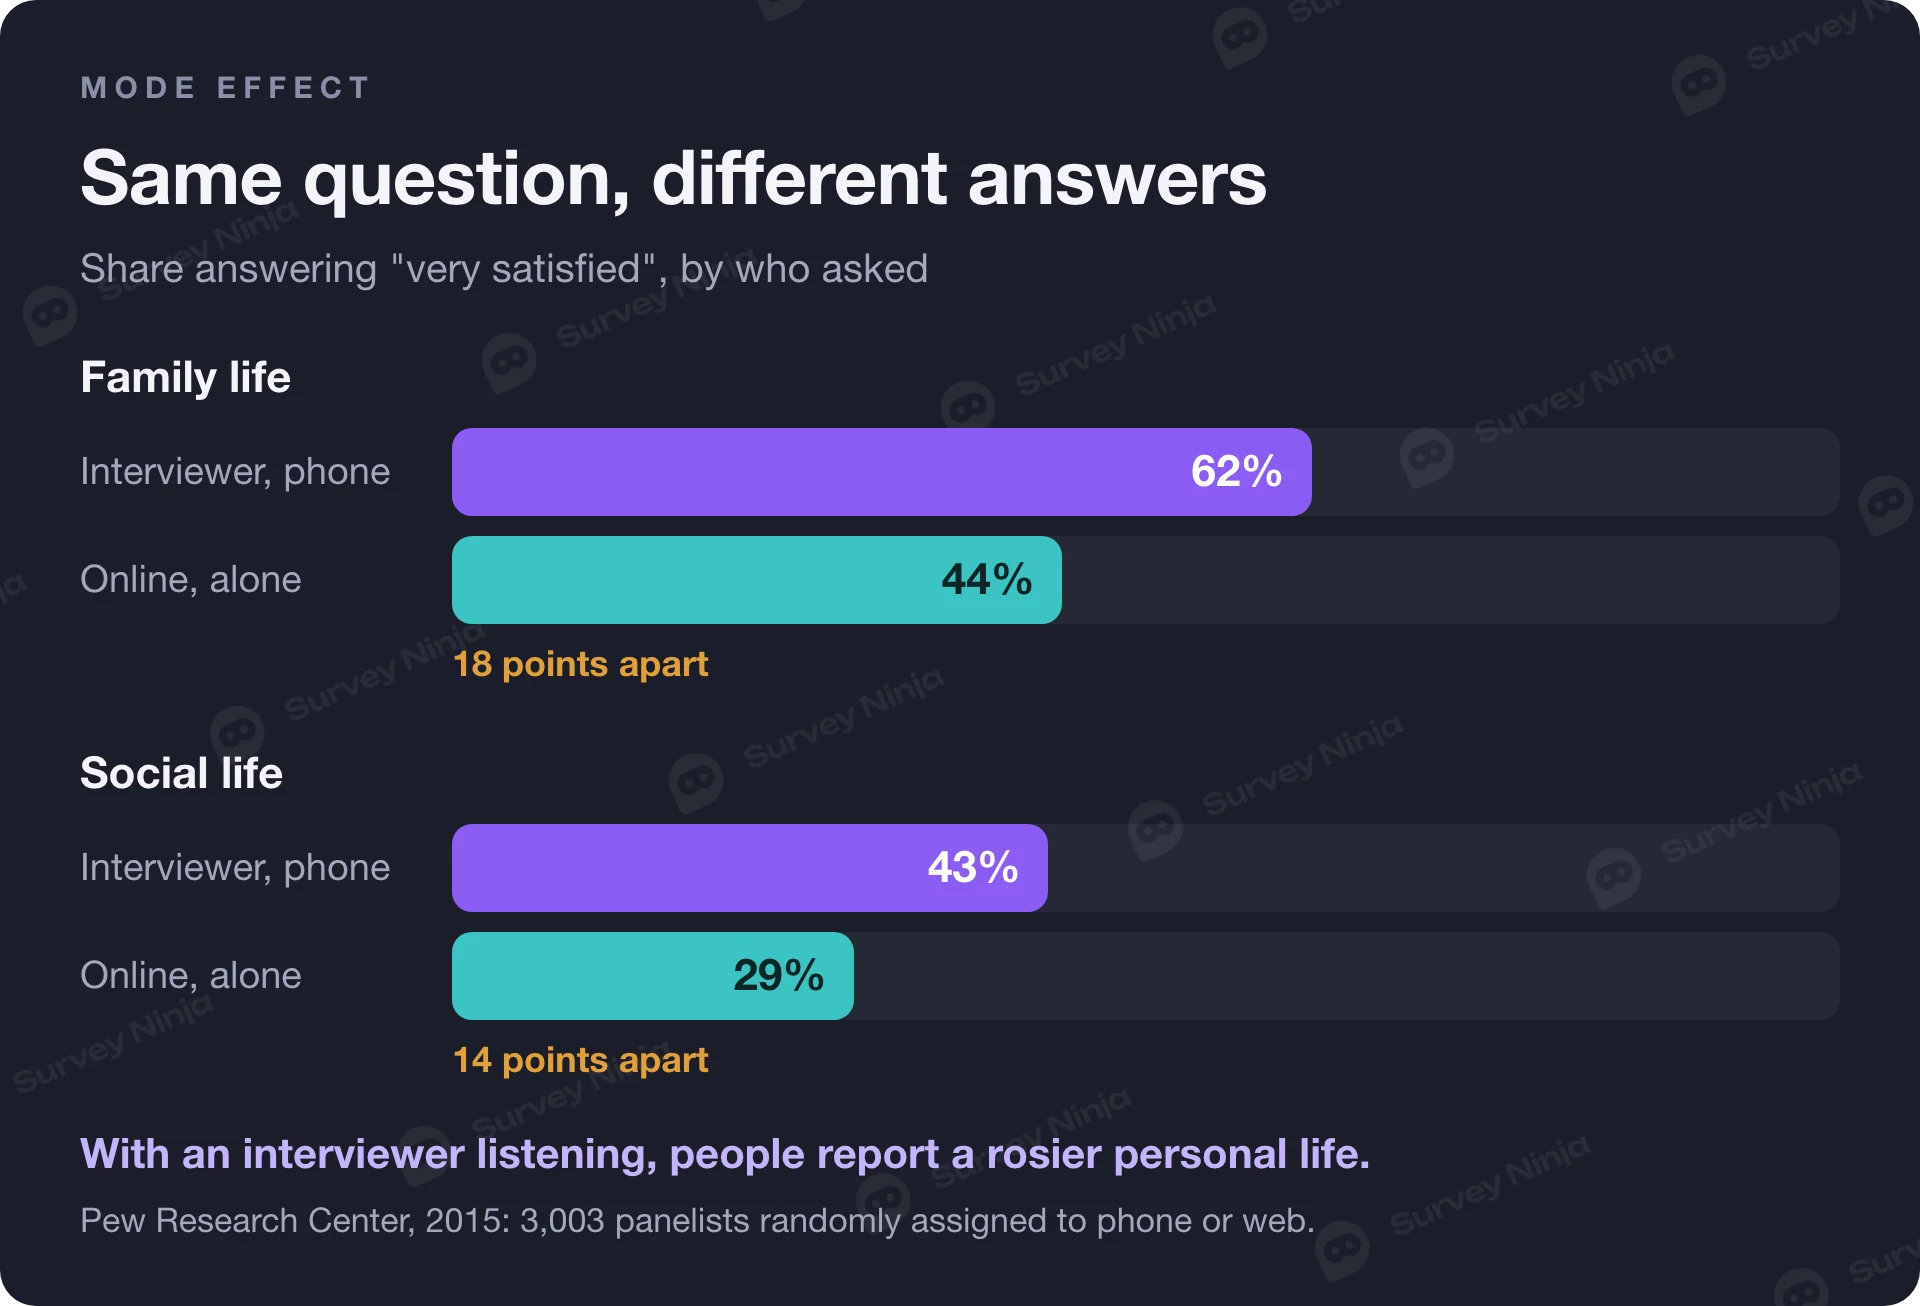
In a Pew Research Center experiment published in 2015, 3,003 panel members were randomly assigned to answer 60 questions either by phone or on the web. On the phone, 62% said they were very satisfied with their family life; on the web, 44% did. For social life, the figures were 43% and 29%. Across all 60 questions the average difference was 5.5 percentage points, and most gaps were small. The largest came on ratings of one's own family and social life, followed by ratings of political figures and questions about discrimination.
The flip side: nobody can clarify a confusing question for an online respondent, so a pilot with five to ten people from the target group matters even more.
How to choose a data collection method for your research question
Choose the method by reading your research question: the verb and the kind of answer it expects point to the technique. "How many", "how often" and "is there a difference" call for a survey; "why" and "how do people experience" call for interviews; "what do people do" calls for observation; "does A change B" calls for an experiment.
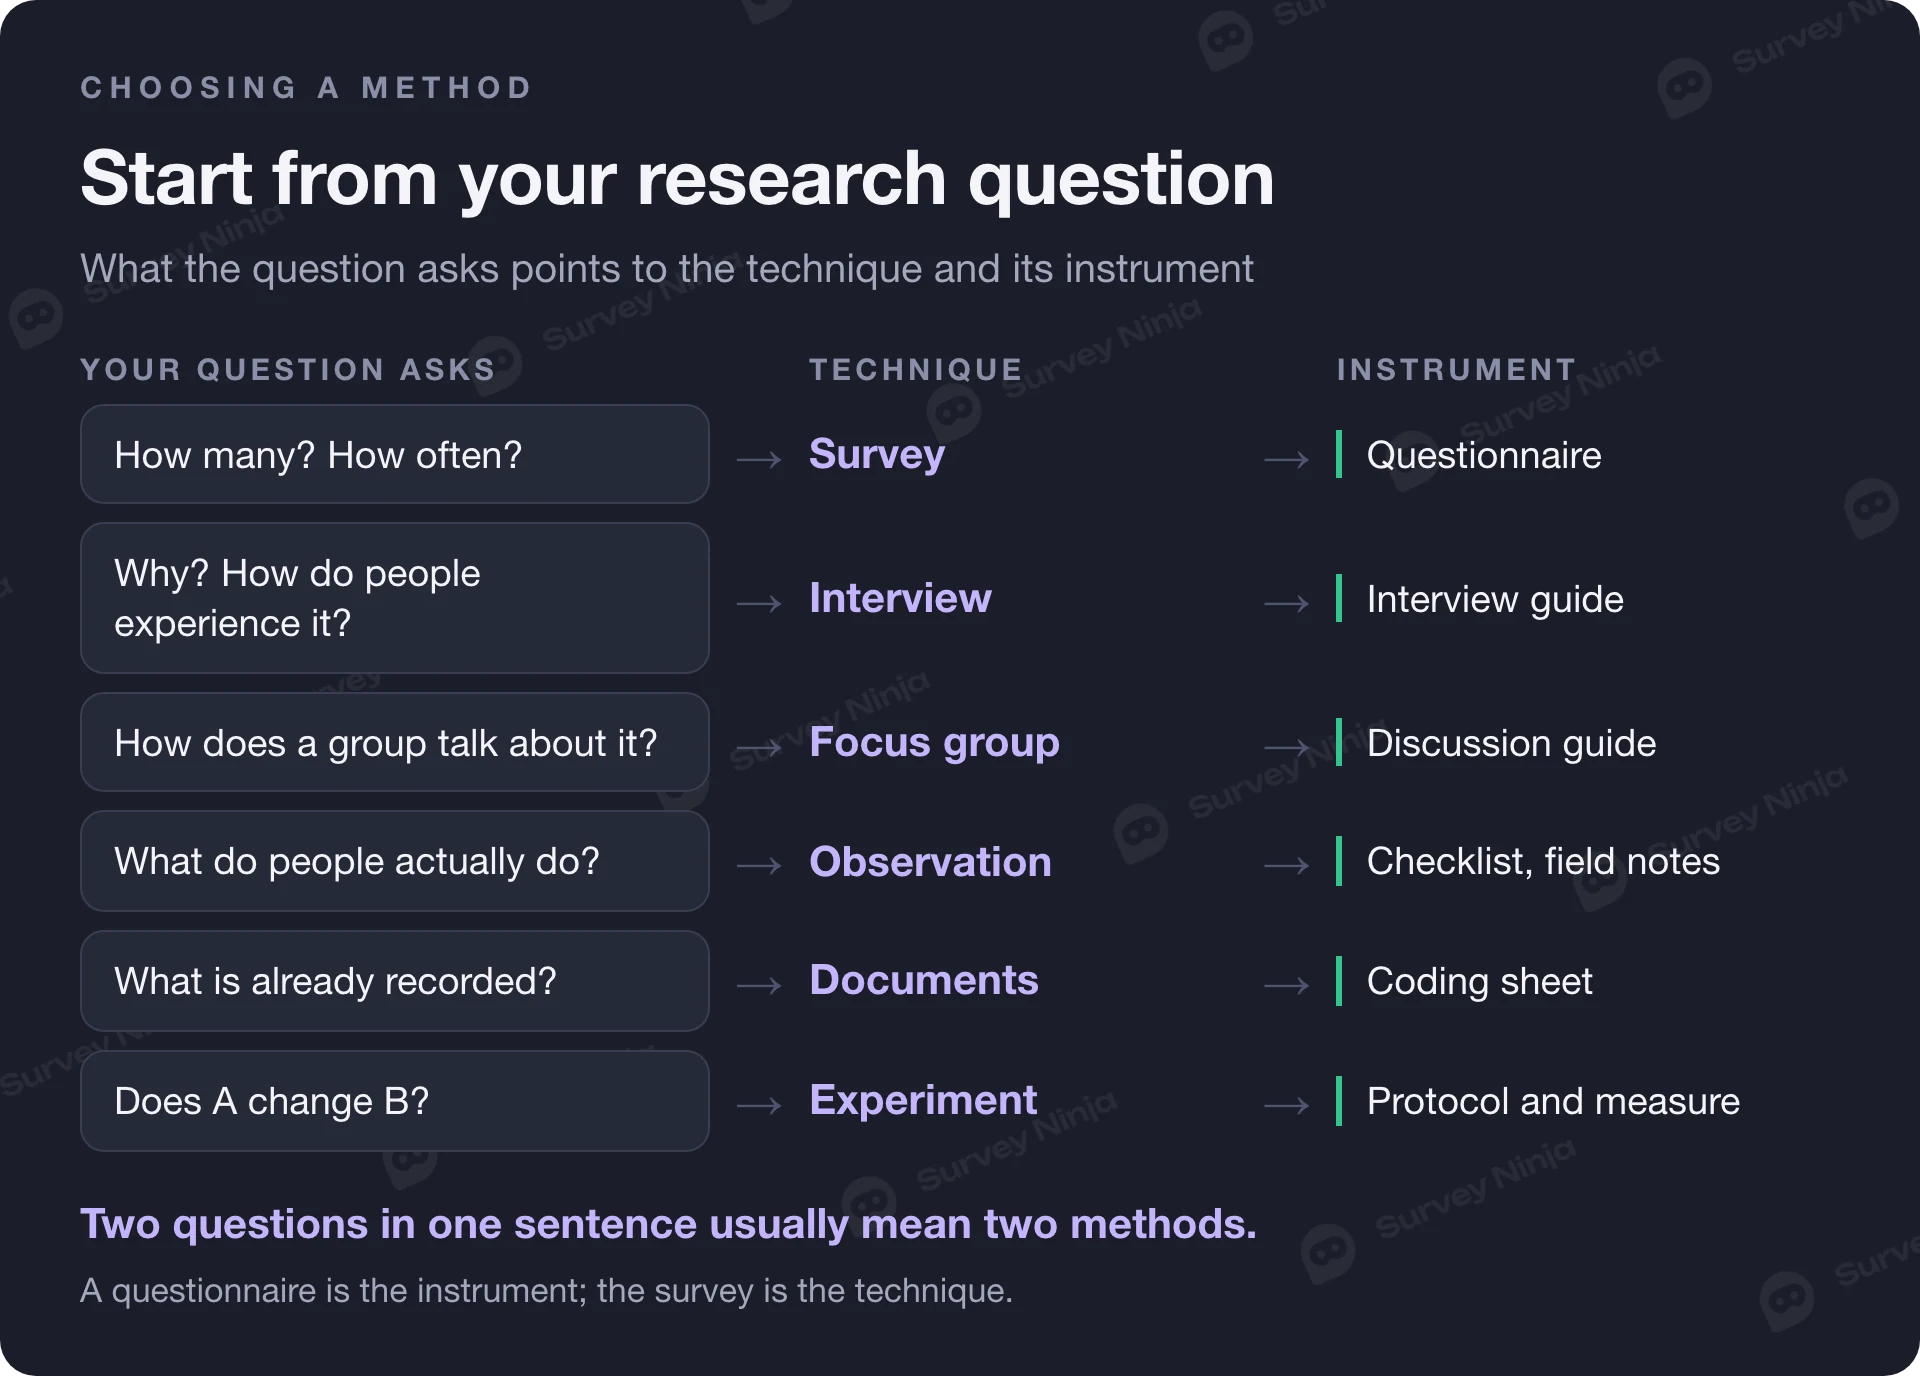
To turn that rule into a decision, go through these steps:
- Write the research question as one sentence. If it has two verbs ("how satisfied are students and why"), it may need two methods.
- Check what is already recorded. Enrollment data, sales logs or a statistics office table may answer part of the question without asking anyone.
- Decide if you need to measure or to understand. Measuring needs many comparable answers; understanding needs fewer people and more depth.
- Consider access and sensitivity. Who can you reach, through which channel, and would people answer honestly with someone listening?
- Check time and skills. Interviews mean transcribing and coding; a survey means sampling, reminders and statistics.
- Pick the instrument and plan the pilot. Adapt a validated instrument where one exists, and test yours on a few people before the real collection.
A worked example: one question, three methods
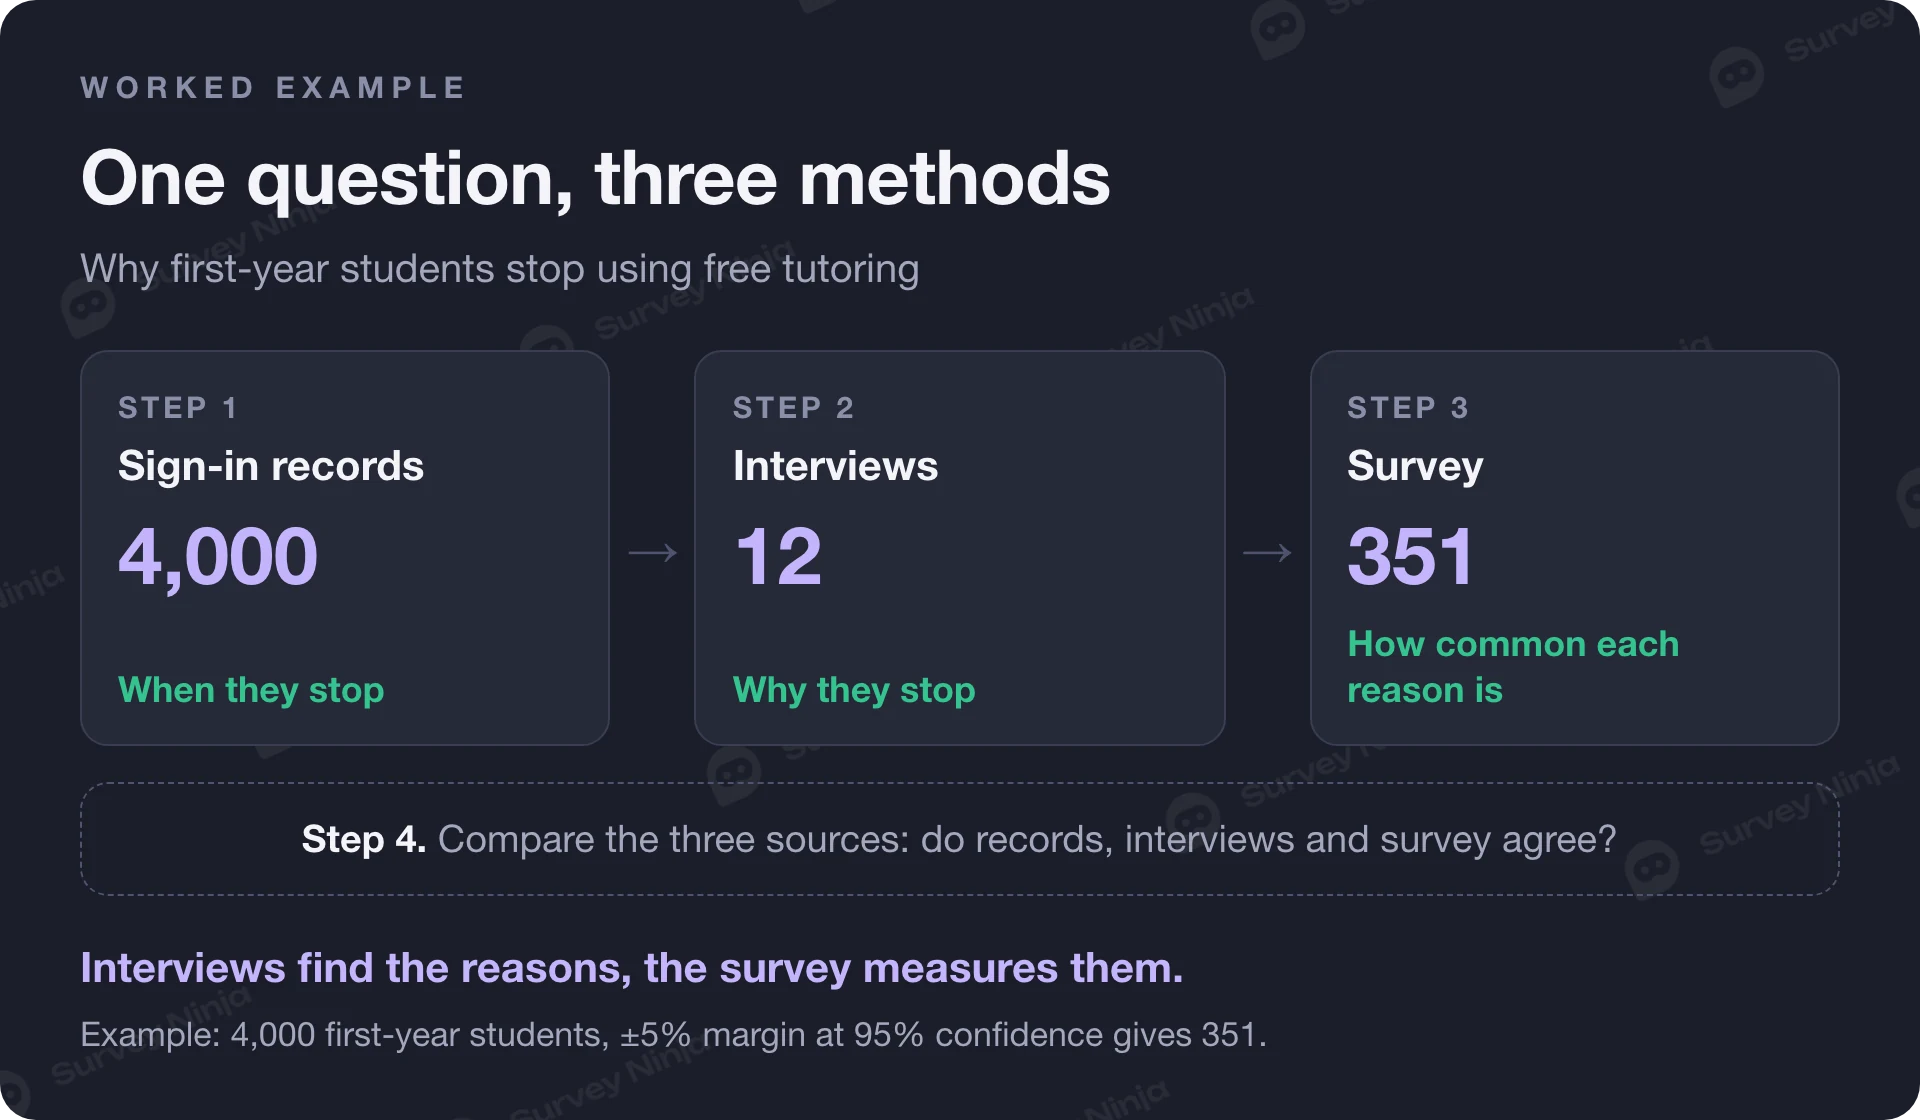
Take a thesis question: "Why do first-year students stop using the free tutoring center, and how widespread are those reasons?" It has two parts, so it needs a mixed design. Assume a university with 4,000 first-year students.
First, records: sign-in logs show when students stop coming, for example after midterms. Second, 12 semi-structured interviews with students who stopped, using a guide on schedule, location, tutors and alternatives, give the reasons in their own words. Third, a survey turns those reasons into answer options of a closed question, plus rating scales on schedule fit and usefulness. For a margin of error of ±5% at 95% confidence, the sample size calculator gives 351 completed questionnaires out of 4,000. Finally, the three sources are compared: if the logs show a drop after midterms and the survey says "no time during exams", the findings support each other.
If the survey is shared through course groups rather than a random list, say so in the limitations and describe it as a non-probability sample; our guide to non-probability sampling explains what you can and cannot claim from it.
How to describe your research instrument in the methodology
In the methodology chapter, describe the instrument so precisely that another researcher could rebuild it. Examiners look for the technique, the instrument, where it came from, how it is structured, how it was checked and how it was applied.
- Name the technique and the instrument separately: "Data were collected through an online survey using a self-administered questionnaire."
- State the origin: designed for this study, or adapted from a published instrument with the citation and what you changed.
- Describe the structure: sections, number of items, question types and the scale used, for example a 5-point agreement scale.
- Explain how you checked validity: expert review of the items, and a pilot with the number of people and what changed afterwards.
- Report reliability for multi-item scales, for example Cronbach's alpha from the pilot or the main sample.
- Describe administration: mode, platform, dates, how participants were invited, reminders and the time the questionnaire took.
- Describe consent and data protection: what participants were told, whether answers were anonymous and who has access.
- Do not call the questionnaire a technique, and do not list methods you did not use.
Here is a short template you can adapt; replace the bracketed parts with your own details:
Methodology template: research instrument paragraph
Data were collected through [technique: an online survey] using a [instrument: self-administered questionnaire] designed for this study, based on [source or literature]. The questionnaire had [number] sections and [number] items: [number] closed questions, a [number]-item [construct] scale rated on a [5-point scale with labels], and [number] open questions. Content validity was reviewed by [number] experts in [field]. A pilot with [number] [participants like the target group] led to [changes]. Internal consistency of the scale in the main sample was [Cronbach's alpha = value]. The questionnaire was shared between [dates] via [channel], took about [minutes] to complete, and began with an information and consent screen. Responses were anonymous.
For the parts around it, see how to write a survey for a thesis, from the research question to the limitations section.
How to collect survey data in SurveyNinja
If your design includes a survey, start with the free research plan generator: describe what you need to find out and it drafts a plan with the objective, method, audience, sample size, questions, channels, timeline, metrics and risks, which is a useful skeleton for the methodology chapter. Our page on academic research with SurveyNinja shows how students and researchers set up a study.
To build the instrument, open the survey maker. Ninja AI (Beta), on every plan including Free, drafts a survey from a description, a file such as the DOCX of your instrument, or an image, and every change waits for you to click Apply. You can choose from 34 question types, add skip logic and quotas, turn on anonymous mode, and share the questionnaire as a link or a QR code. Responses export to CSV, XLSX, SPSS and PDF on all plans, so the analysis can continue in the software your department uses.
Frequently asked questions
What are the main data collection methods?
The main data collection methods are surveys with questionnaires, interviews, focus groups, observation, document and records analysis, and experiments. Surveys and experiments mostly produce numbers, interviews, focus groups and documents mostly produce text, and observation can do both. Many studies combine two methods, for example interviews to find reasons and a survey to measure how common they are.
What is the difference between a data collection technique and an instrument?
A technique is the procedure used to collect data, such as a survey, an interview or observation. An instrument is the concrete tool that applies the technique, such as a questionnaire, an interview guide or an observation checklist. The survey is the technique and the questionnaire is its instrument, which is why methodology chapters should name both.
What is a research instrument?
A research instrument is the tool a researcher uses to collect, measure or record data: a questionnaire, an interview guide, an observation checklist, a coding sheet, a test or a validated scale. In a thesis it is usually attached as an appendix. A good instrument measures what it claims to measure and gives consistent results, which you show through expert review, a pilot and reliability figures.
Is a questionnaire a technique or an instrument?
A questionnaire is a research instrument. The technique it serves is the survey, whether the questionnaire is filled in online, on paper or read aloud by an interviewer in a structured interview. Writing "the technique used was the questionnaire" is a common mistake in methodology chapters; write that data were collected through a survey using a questionnaire.
How do I choose a data collection method for my thesis?
Start from the research question. Questions about how many, how often or differences between groups call for a survey; questions about why or how people experience something call for interviews or focus groups; questions about behavior call for observation; questions about cause call for an experiment. Then check access, sensitivity of the topic, time and existing records.
Are interviews qualitative or quantitative?
Most research interviews are qualitative: semi-structured and unstructured interviews collect detailed answers that you interpret through coding. A structured interview in which an interviewer reads a fixed questionnaire with closed answers produces quantitative data, so it is really a survey administered in person or by phone. The type depends on how fixed the questions and answer options are.
Published: Nov 19, 2026