 25 Questions for a Travel Agency Customer Satisfaction Survey
Customer Effort Score: How to Ask, Calculate and Act on CES
Useful  Mike Taylor Sep 30, 2026 Reading time ≈ 13 min

Customer effort score (CES) asks one question right after an interaction: how easy was it to get this done? It is the most direct way to find friction in support, onboarding and checkout. It also comes in two versions that point in opposite directions and several formulas, so the same answers can produce very different numbers.
The definitions live in our glossary entries on CES and the revised CES 2.0. This guide is about running it: which question to ask, how to score the answers, when to send the survey and what to do with the results.
Where customer effort score comes from
CES was introduced in 2010 by the Corporate Executive Board, now part of Gartner, in a Harvard Business Review article with a blunt title: "Stop Trying to Delight Your Customers". The authors, Matthew Dixon, Karen Freeman and Nick Toman, drew on data from 75,000 customers who had contacted B2B and B2C companies by phone or online.
Their argument was that exceeding expectations barely moves loyalty, while making things easy does. Among customers who reported low effort, 94% said they intended to buy again and 88% said they would spend more. Among those who reported high effort, 81% said they intended to spread negative word of mouth.
Keep one detail in mind. The research looked at service interactions, people who had contacted a company with a request. That is where CES works best, and it explains the limits covered further down.
The CES question: version 1.0 and 2.0
The original question was "How much effort did you personally have to put forth to handle your request?", answered from 1 (very low effort) to 5 (very high effort). Lower was better. That is the opposite of almost every other rating people see, so a 4 could easily be read as good when it meant hard.
The revised version, now called CES 2.0, turns the question into a statement: "The company made it easy for me to handle my issue." Customers rate their agreement from 1 (strongly disagree) to 7 (strongly agree), so a higher number is better. Gartner counts 5, 6 and 7 as favorable answers.
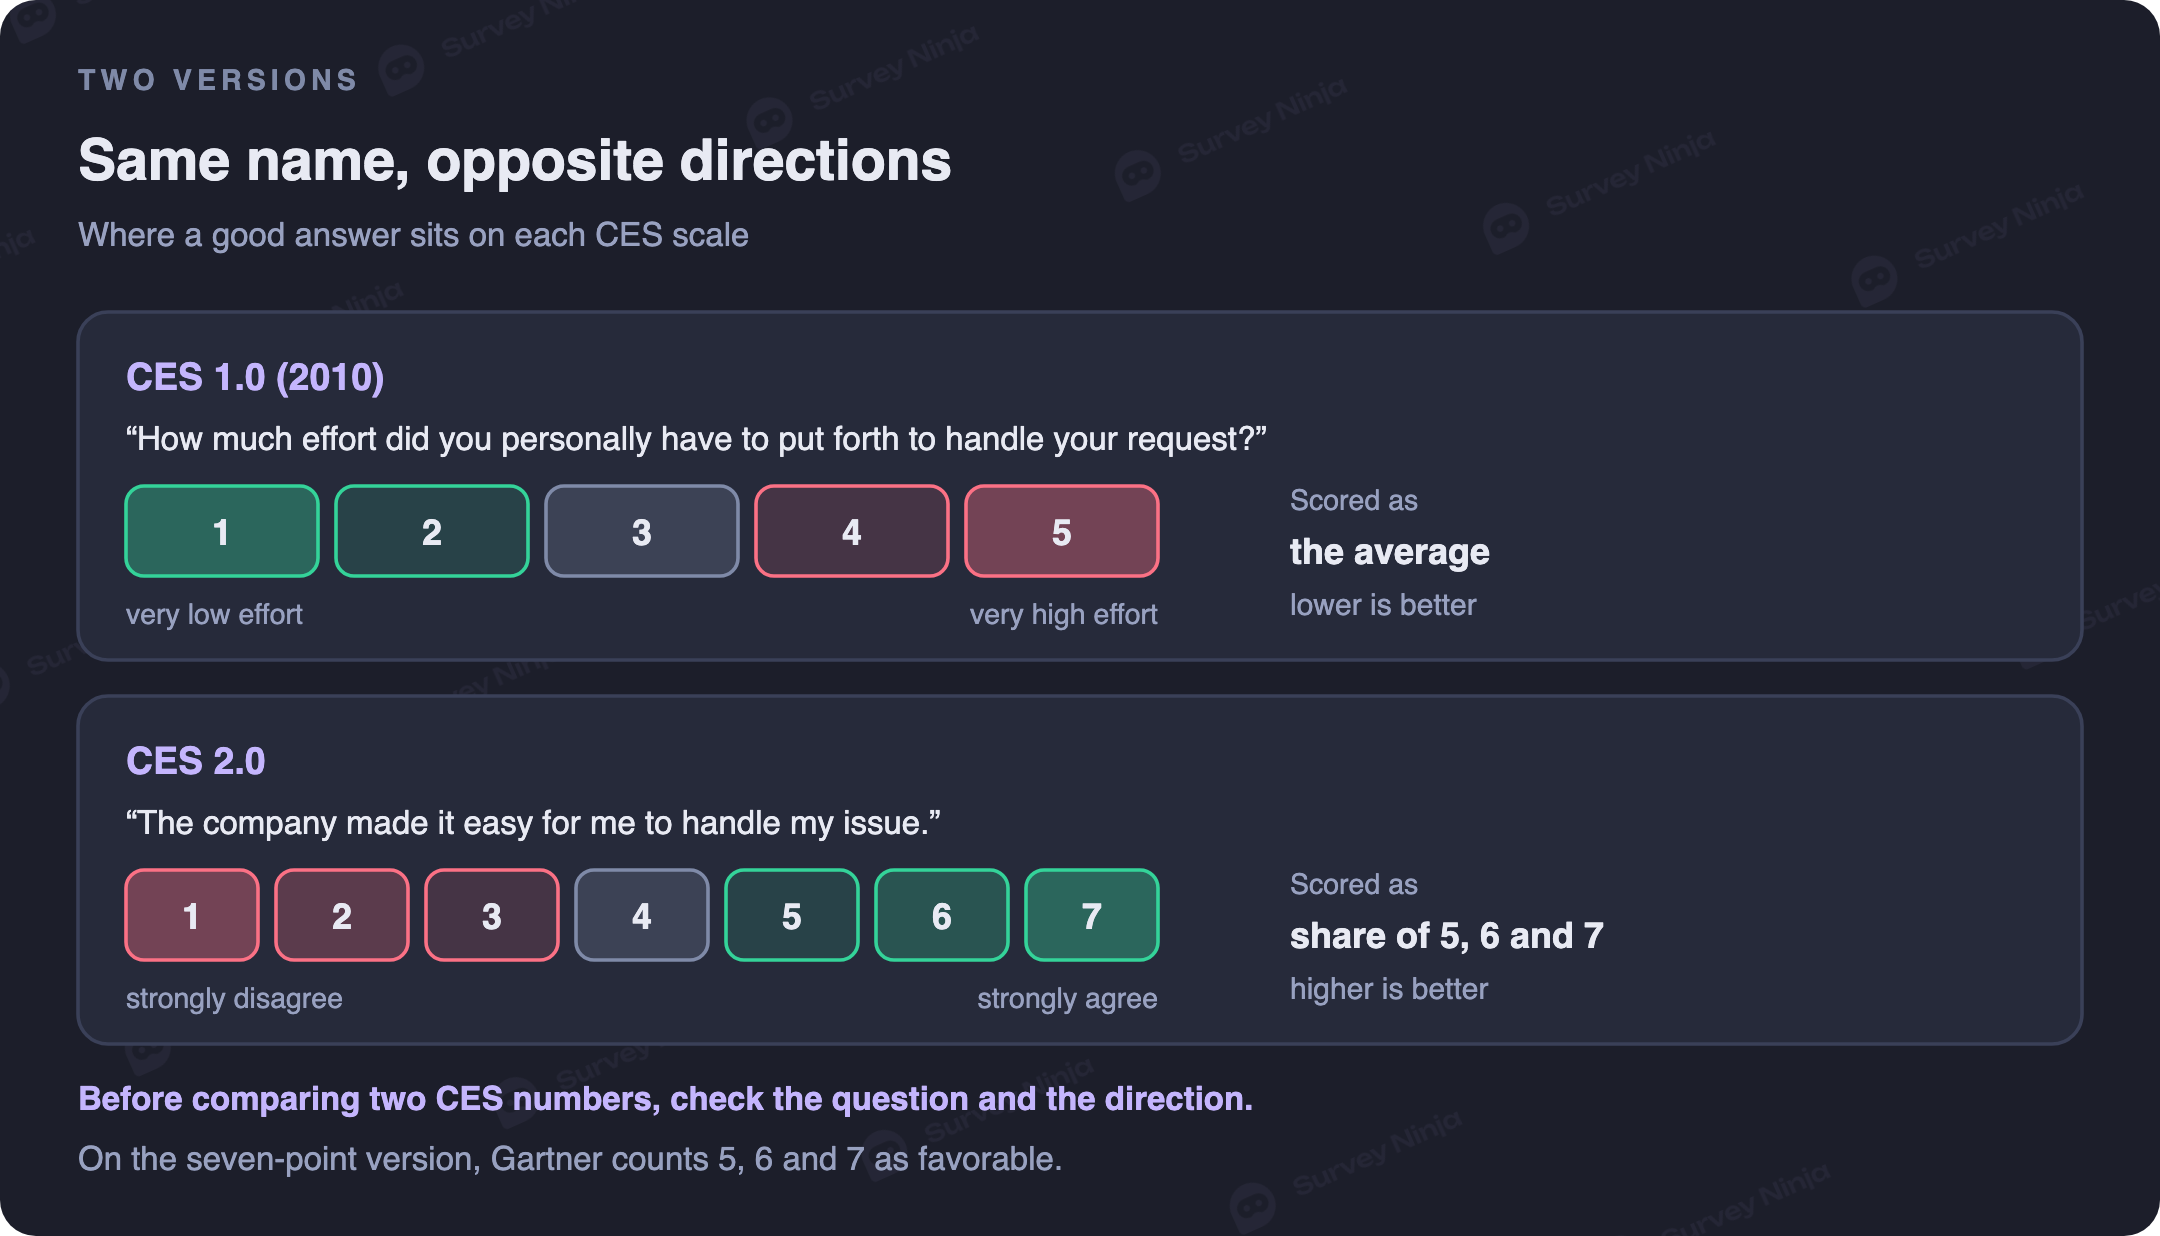
You can adapt the object of the statement to the touchpoint: "made it easy to complete my order", "to set up my account", "to return the product". Keep the rest fixed.
Many teams use a third, simpler wording: "How easy was it to...?" on a five-point scale from very difficult to very easy. It works as long as you pick one question, label both ends and keep the easy end on the same side in every survey. Never switch versions in the middle of a series. Our CES calculator uses the original direction, where 1 means very easy and a lower average is better, so check the direction before you paste in numbers.
How to calculate customer effort score
There is no single CES formula. Three are common, and they give very different numbers from the same answers:
- Average. The sum of all scores divided by the number of responses. The original CES was scored this way.
- Share of easy answers. The percentage of respondents at the favorable end of the scale: 5, 6 or 7 on the seven-point version. This is a top-box score.
- Easy minus difficult. The share of easy answers minus the share of difficult ones, 1, 2 or 3 on the seven-point version, in the spirit of NPS.
Here is one set of 200 answers to the CES 2.0 statement, scored all three ways:
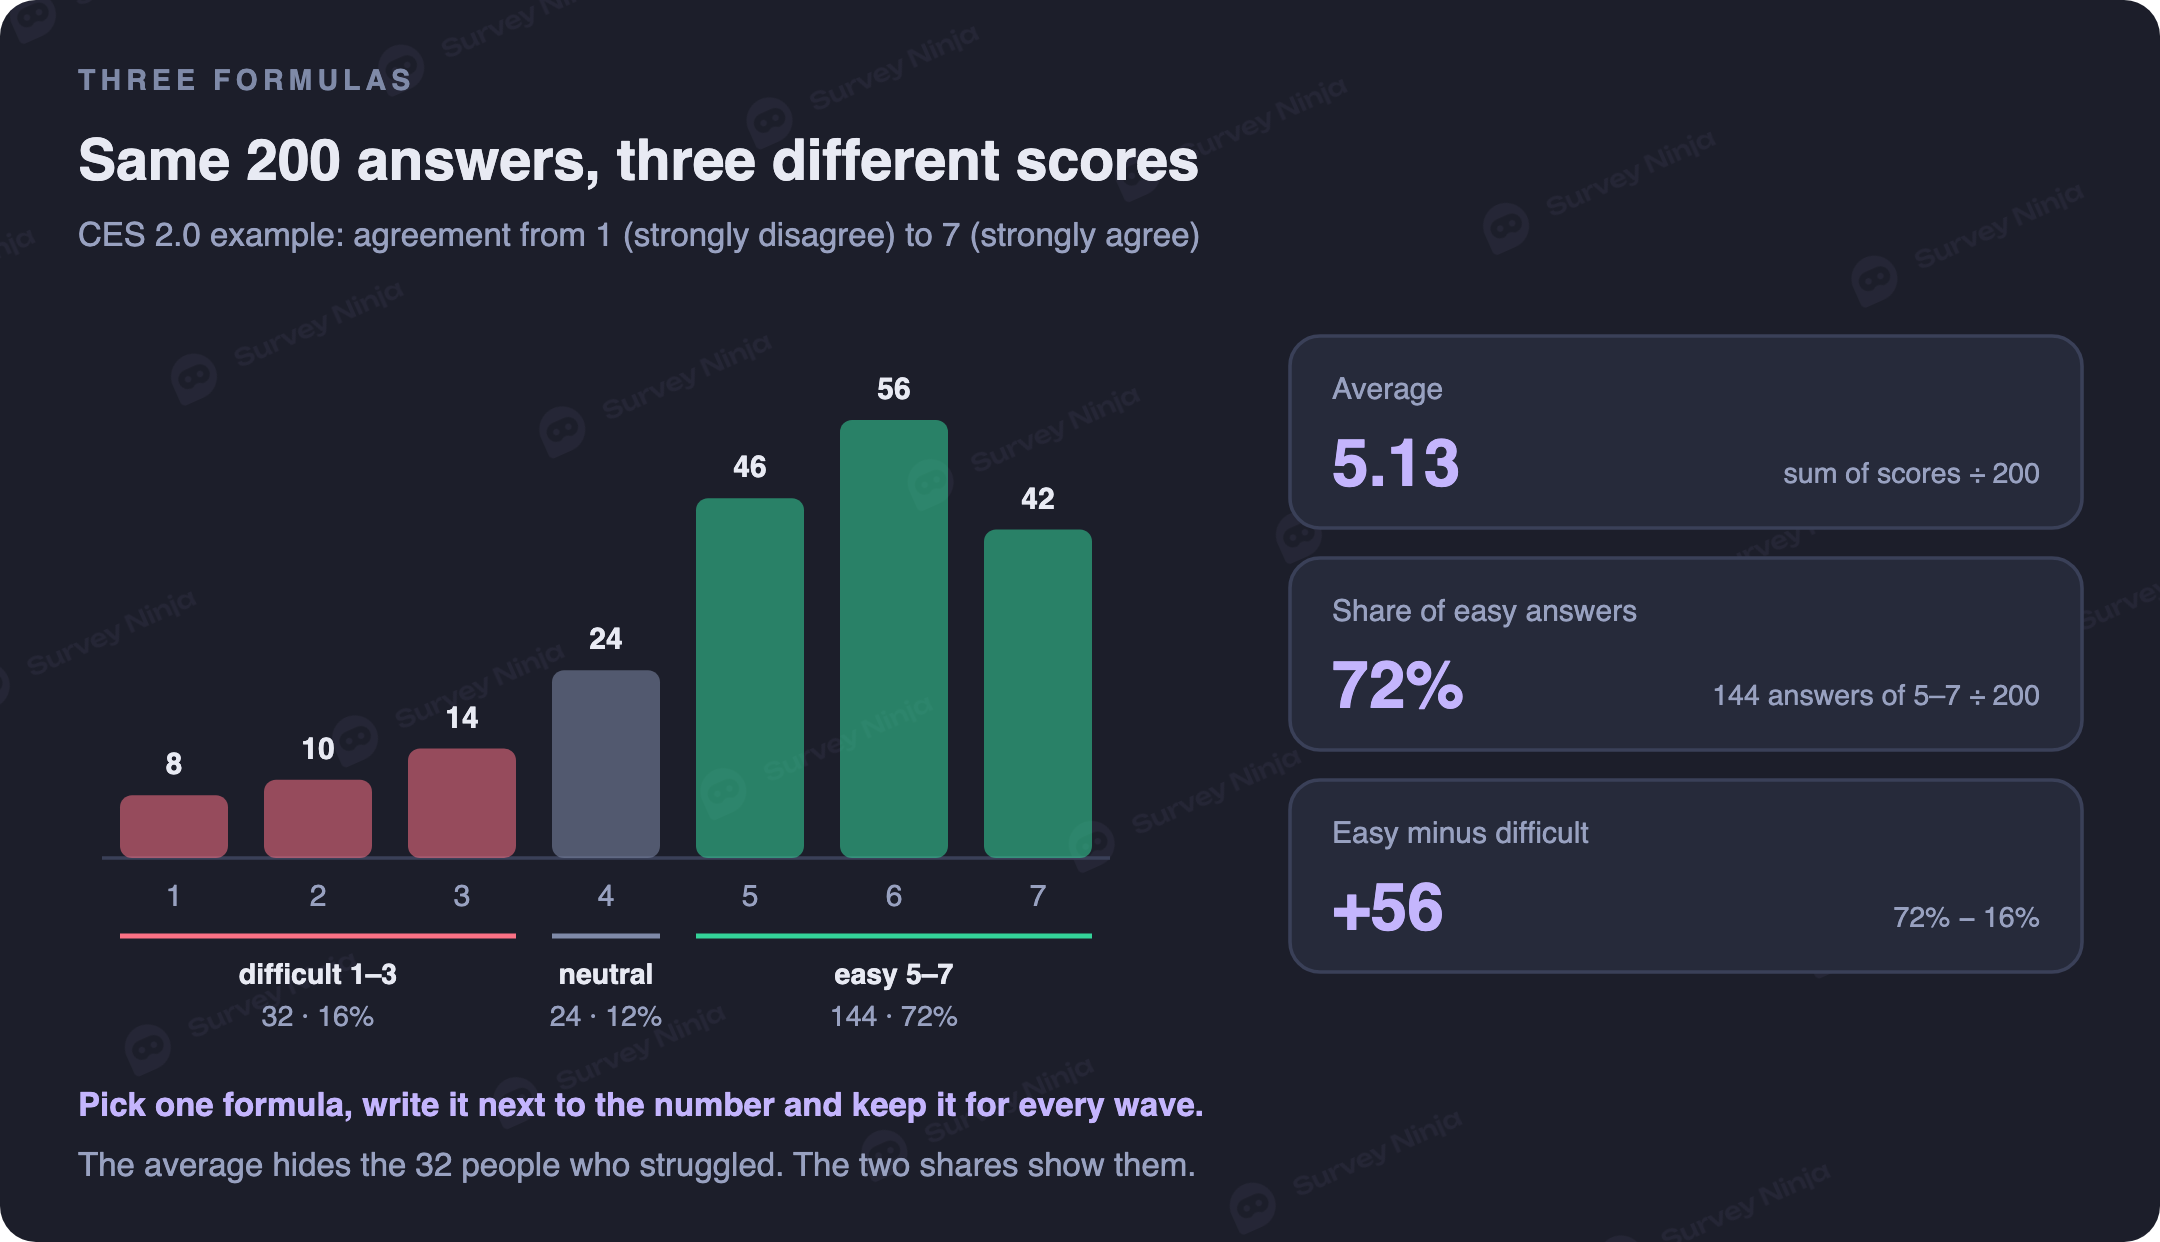
The average is 5.13, which sounds fine and says little. The share of easy answers is 72%. Easy minus difficult is +56, because 16% of respondents, 32 people, found the interaction hard. The two shares keep those people visible, while the average blends them into everyone else.
For most teams the share of easy answers is the best headline. It is simple to explain, it matches the way Gartner scores CES 2.0, and it can be compared across channels. Report the share of difficult answers next to it, because that is the group you will act on. The top-box calculator computes both shares from raw answers. If you use the original direction, the CES calculator gives you the average.
Mind the margin of error. With 200 answers, a 72% share carries a margin of about ±6 points at 95% confidence, so a move from 72% to 75% next month is not a trend. The margin of error calculator gives the range for your own numbers.
When and where to send the CES survey
CES describes one interaction, so it has to arrive while that interaction is fresh: minutes or hours after it ends, not a week later. Typical triggers:
- a support ticket is closed or a chat ends;
- a customer finishes onboarding or sets up a key feature;
- an order is placed, a delivery arrives or a return is processed;
- someone reads a help article or solves a problem through self-service.
Send it through the channel where the interaction happened: at the end of the chat, inside the app, in the email that confirms the ticket is solved. Attach the context to each response, such as channel, issue type, team and ticket ID. Later you will want to see where the effort comes from, not only how much of it there is.
Ask only people who have just done something. CES cannot describe customers who never contacted you, and there are many of them. In a Dutch study of customers of 93 firms, only about one in five had contacted the company with a request. Everyone else simply had no CES to give.
Add one follow-up question
The score tells you how much effort there was, not why. Add one open question for low scores only, using branching: "What made it difficult?" Keep it optional. A required text box after a low rating can push people to go back and raise the rating just to skip it.
If you want countable answers, offer a short list of reasons before the text box: had to contact you more than once, was transferred, had to repeat information, had to switch channels, it took too long, something else. The list turns hundreds of comments into a chart you can sort by frequency. Open answers still need reading, and our guide to thematic analysis shows how to tag them into themes without losing the detail.
What is a good CES score
There is no universal benchmark. The number depends on the question, the scale, the formula, the industry and the channel, and published benchmarks rarely say which of these they used. A 72% in phone support and a 72% after checkout are not the same achievement.
The comparisons that hold are internal: the same question, scale and formula across channels, teams, issue types and months. Set your own baseline in the first few weeks. After that, look only for changes larger than the margin of error.
CES, CSAT and NPS: which one for what
The three metrics answer different questions and belong at different moments:
| CES | CSAT | NPS | |
|---|---|---|---|
| Question | How easy was it? | How satisfied are you? | How likely are you to recommend us? |
| Measures | Effort in one interaction | Satisfaction with an interaction or a product | The overall relationship |
| When to ask | Right after the interaction | Right after the interaction | On a regular schedule, not tied to one contact |
| Typical scale | 1–7 agreement or 1–5 ease | 1–5 | 0–10 |
| Best use | Finding friction in a process | Checking an interaction or a product | Tracking loyalty over time |
CES is not a better loyalty metric than the other two. The Dutch study mentioned above, by de Haan, Verhoef and Wiesel (2015), surveyed 6,649 customers of 93 firms in 18 industries and checked two years later who had stayed. Top-2-box satisfaction and NPS predicted retention best. CES performed worst by a wide margin, even among customers who had made a request, although that group was small.
So use CES as a diagnostic for processes, and NPS or CSAT as the relationship metric. Our comparison of NPS, CSAT, CES and CSI covers when to use each, and CSAT vs NPS goes deeper into the pair most teams start with.
Turning low scores into fixes
Start with the difficult answers, not the average. Sort them by channel, issue type and team, and look for concentrations. One issue type that produces half of the difficult answers is a better target than a small drop everywhere.
Then read the comments for the largest groups and check them against operational data: repeat contacts, transfers, time to resolution. If customers say they had to explain the problem twice, the fix is in the handoff, not in the agent's tone.
Close the loop with the people who struggled. A short reply from a team lead after a very low score can turn a complaint into a detail you can fix, and it shows that someone reads the survey. After the change, measure the same touchpoint again with the same question, scale and formula. Judge the fix by the share of difficult answers, since that is the group it was meant to help.
Common mistakes with CES
- Mixing CES 1.0 and 2.0, or five- and seven-point scales, in one trend line.
- Reporting an average in one report and a share in the next.
- Sending the survey days after the interaction.
- Asking about the whole relationship instead of one interaction.
- Making the follow-up question mandatory.
- Comparing your score with a benchmark that was measured another way.
- Treating CES as the only loyalty metric.
How to run a CES survey in SurveyNinja
Add a rating question with the CES 2.0 statement and a seven-point agreement scale, or a five-point ease scale, and label both ends. Add an optional open question that branching shows only for scores of 1 to 3. Send the survey after a closed ticket or a finished chat, the way the CSAT use case is set up, and route alerts about low scores to your team channel. Pass the channel, team and ticket ID through hidden fields so every answer keeps its context. SurveyNinja calculates the scale average and builds charts by wave and segment, and the answers export to CSV for your own analysis. If support is your main use, the page for customer support teams shows typical setups, and you can start building for free.
Frequently asked questions
What is customer effort score?
CES is a one-question survey metric that shows how easy it was for a customer to get something done with a company, such as resolving an issue, placing an order or setting up an account. It is asked right after the interaction.
What is the CES survey question?
The current standard, CES 2.0, is the statement "The company made it easy for me to handle my issue", rated from 1 (strongly disagree) to 7 (strongly agree). The original 2010 version asked how much effort the customer personally had to put forth, from 1 (very low) to 5 (very high).
How do you calculate customer effort score?
The three common methods are the average score, the share of easy answers (5, 6 or 7 on the seven-point scale) and the share of easy answers minus the share of difficult ones (1, 2 or 3). The same 200 answers can give 5.13, 72% and +56, so always state which formula you used.
What is a good CES score?
There is no universal benchmark, because the score depends on the question, scale, formula, industry and channel. Compare it with your own baseline measured the same way, and treat changes smaller than the margin of error as noise.
When should you send a CES survey?
Right after the interaction you want to evaluate: when a support ticket is closed, a chat ends, an order is placed or onboarding is finished. Send it minutes or hours later, not days, while the customer still remembers the details.
Is CES better than NPS or CSAT?
Not as a loyalty metric. In a 2015 study of customers of 93 firms in the Netherlands, satisfaction and NPS predicted retention better than CES. CES is most useful as a diagnostic that shows which processes create friction.
Published: Sep 30, 2026