 25 Questions for a Travel Agency Customer Satisfaction Survey
Customer Satisfaction Index: How to Calculate CSI and Read the Results
Useful  Mike Taylor Oct 1, 2026 Reading time ≈ 13 min

A customer satisfaction index (CSI) turns satisfaction with several parts of your service into one number, weighted by how much each part matters to customers. The number is useful for tracking. The weights are more useful still, because they show which weak spot costs you the most and should be fixed first.
The short definitions are in our glossary entries on CSI and the national ACSI. If you are still choosing between CSI, CSAT, NPS and CES, start with our comparison of the four metrics. This guide is about running a CSI study from the first attribute to the last decision.
What a customer satisfaction index measures
A CSAT survey asks one question: how satisfied are you? A CSI asks about each part of the experience separately, such as product quality, delivery, price, the website and support. It also asks how important each part is. The index combines the two, so a low score on something customers barely care about weighs less than a low score on something they care about a lot.
The term covers two different things. Companies use it for their own weighted index, the one this guide explains. Countries use it for national benchmarks such as the American Customer Satisfaction Index, which rests on a statistical model and a large annual sample. The formula below is the practical version any company can run with its own customers. The national version is covered further down.
Step 1. Choose the attributes
Attributes are the specific things a customer experiences. "Delivery speed" works. "Logistics" does not, because no customer experiences logistics. Take the list from customer language rather than from your org chart: support tickets, reviews, open answers from earlier surveys and a few short interviews. A CSI has a built-in weakness here. Customers can only rate the attributes you put in front of them, so an attribute you forgot never shows up as a problem.
Six to twelve attributes is a workable range; the example in this guide uses five so it fits on one chart. Fewer, and you miss real drivers. More, and respondents rush through the second half. Each attribute should be one thing: "fast and friendly support" is two attributes, and a single score cannot tell you which half failed. Once the list is set, keep it fixed between waves, or the index stops being comparable over time.
Step 2. Write the CSI survey questions
Every attribute gets two questions on the same scale. A 1–10 scale with labeled ends is common, and it is what the example below uses:
- Importance: "How important is delivery speed to you when you shop online?" from 1 (not important at all) to 10 (extremely important).
- Satisfaction: "How satisfied are you with our delivery speed?" from 1 (very dissatisfied) to 10 (very satisfied).
Ask all the importance questions as one block, then all the satisfaction questions as another, so the respondent stays in one mode at a time. Give people a "does not apply" option for attributes they have not experienced. Someone who never contacted support should not rate it. End with one overall question, "Overall, how satisfied are you with us?", which you will need for derived importance later.
The survey gets long fast: eight attributes mean seventeen rating questions. A grid layout keeps it manageable, and our guide on reducing survey dropout covers the rest of what keeps people answering until the end.
Step 3. Calculate the index
The calculation has five steps:
- Average the importance scores for each attribute across all respondents.
- Turn the averages into weights: each attribute's average importance divided by the sum of all the averages. The weights add up to 100%.
- Average the satisfaction scores for each attribute.
- Multiply each attribute's average satisfaction by its weight.
- Add the results, divide by the top of the scale and multiply by 100.
Here it is for an online store with five attributes. The importance averages add up to 40.3, so product quality, with an average importance of 9.5, gets a weight of 9.5 ÷ 40.3 = 23.6%.
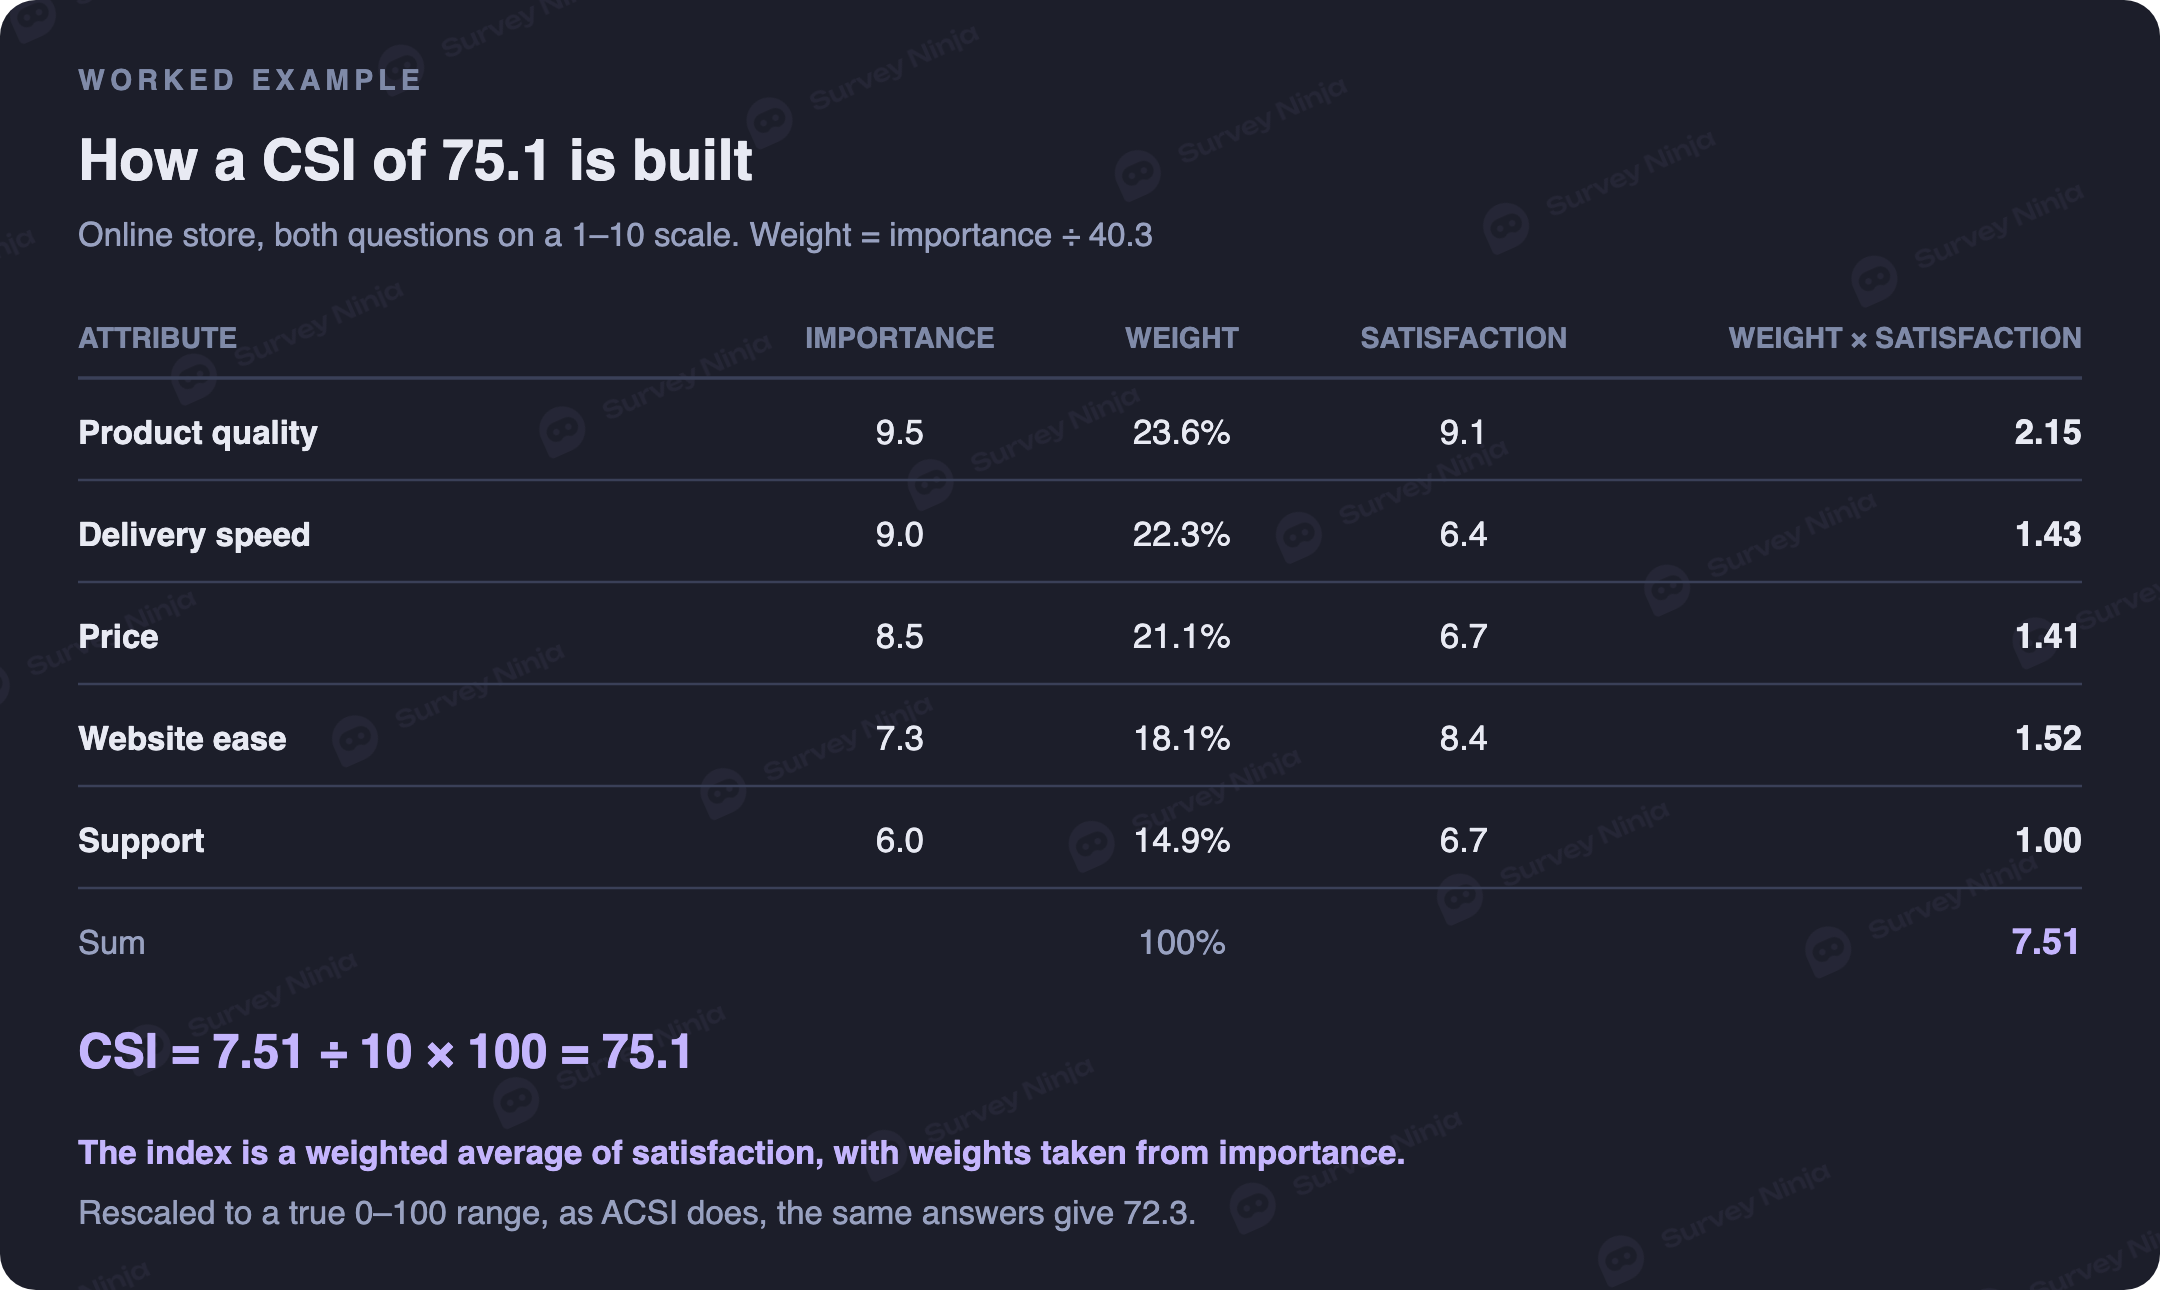
The weighted satisfaction adds up to 7.51, so the index is 7.51 ÷ 10 × 100 = 75.1. One detail is easy to miss. Dividing by the top of the scale maps a 1–10 scale onto 10–100, not 0–100: a customer who gave 1 to everything would still produce a CSI of 10. ACSI avoids this by rescaling with (score − 1) ÷ 9 × 100, which turns the same answers into 72.3. Either version works, as long as you pick one and keep it.
Stated or derived importance
Asking people directly how important each attribute is, called stated importance, is transparent and easy to explain. Its weakness is that respondents call almost everything important, so the weights bunch together. In the example they only range from 14.9% to 23.6%.
The alternative is derived importance. Correlate each attribute's satisfaction with the overall satisfaction question: attributes whose scores move together with overall satisfaction matter more, whatever people say. Our guide to correlation in surveys explains how to read the coefficients, and the Pearson correlation calculator computes them from two columns of answers. Derived importance needs a decent sample. With a few dozen answers, stated importance is the safer choice.
Step 4. Find what to fix first
The index alone tells you little. The attribute breakdown is where the decisions are. Two simple readings work together.
The first is the importance–satisfaction matrix, known in research as importance-performance analysis. Martilla and James described it in the Journal of Marketing in 1977, using data from car dealers. Each attribute goes on a chart by its average importance and average satisfaction, with lines at the averages, which splits the chart into four corners: fix first, keep it up, low priority and don't overinvest.
The second is lost points. For each attribute, multiply its weight by the gap between its satisfaction and the top of the scale: weight × (10 − satisfaction) × 10. The lost points add up exactly to the distance between the index and 100.
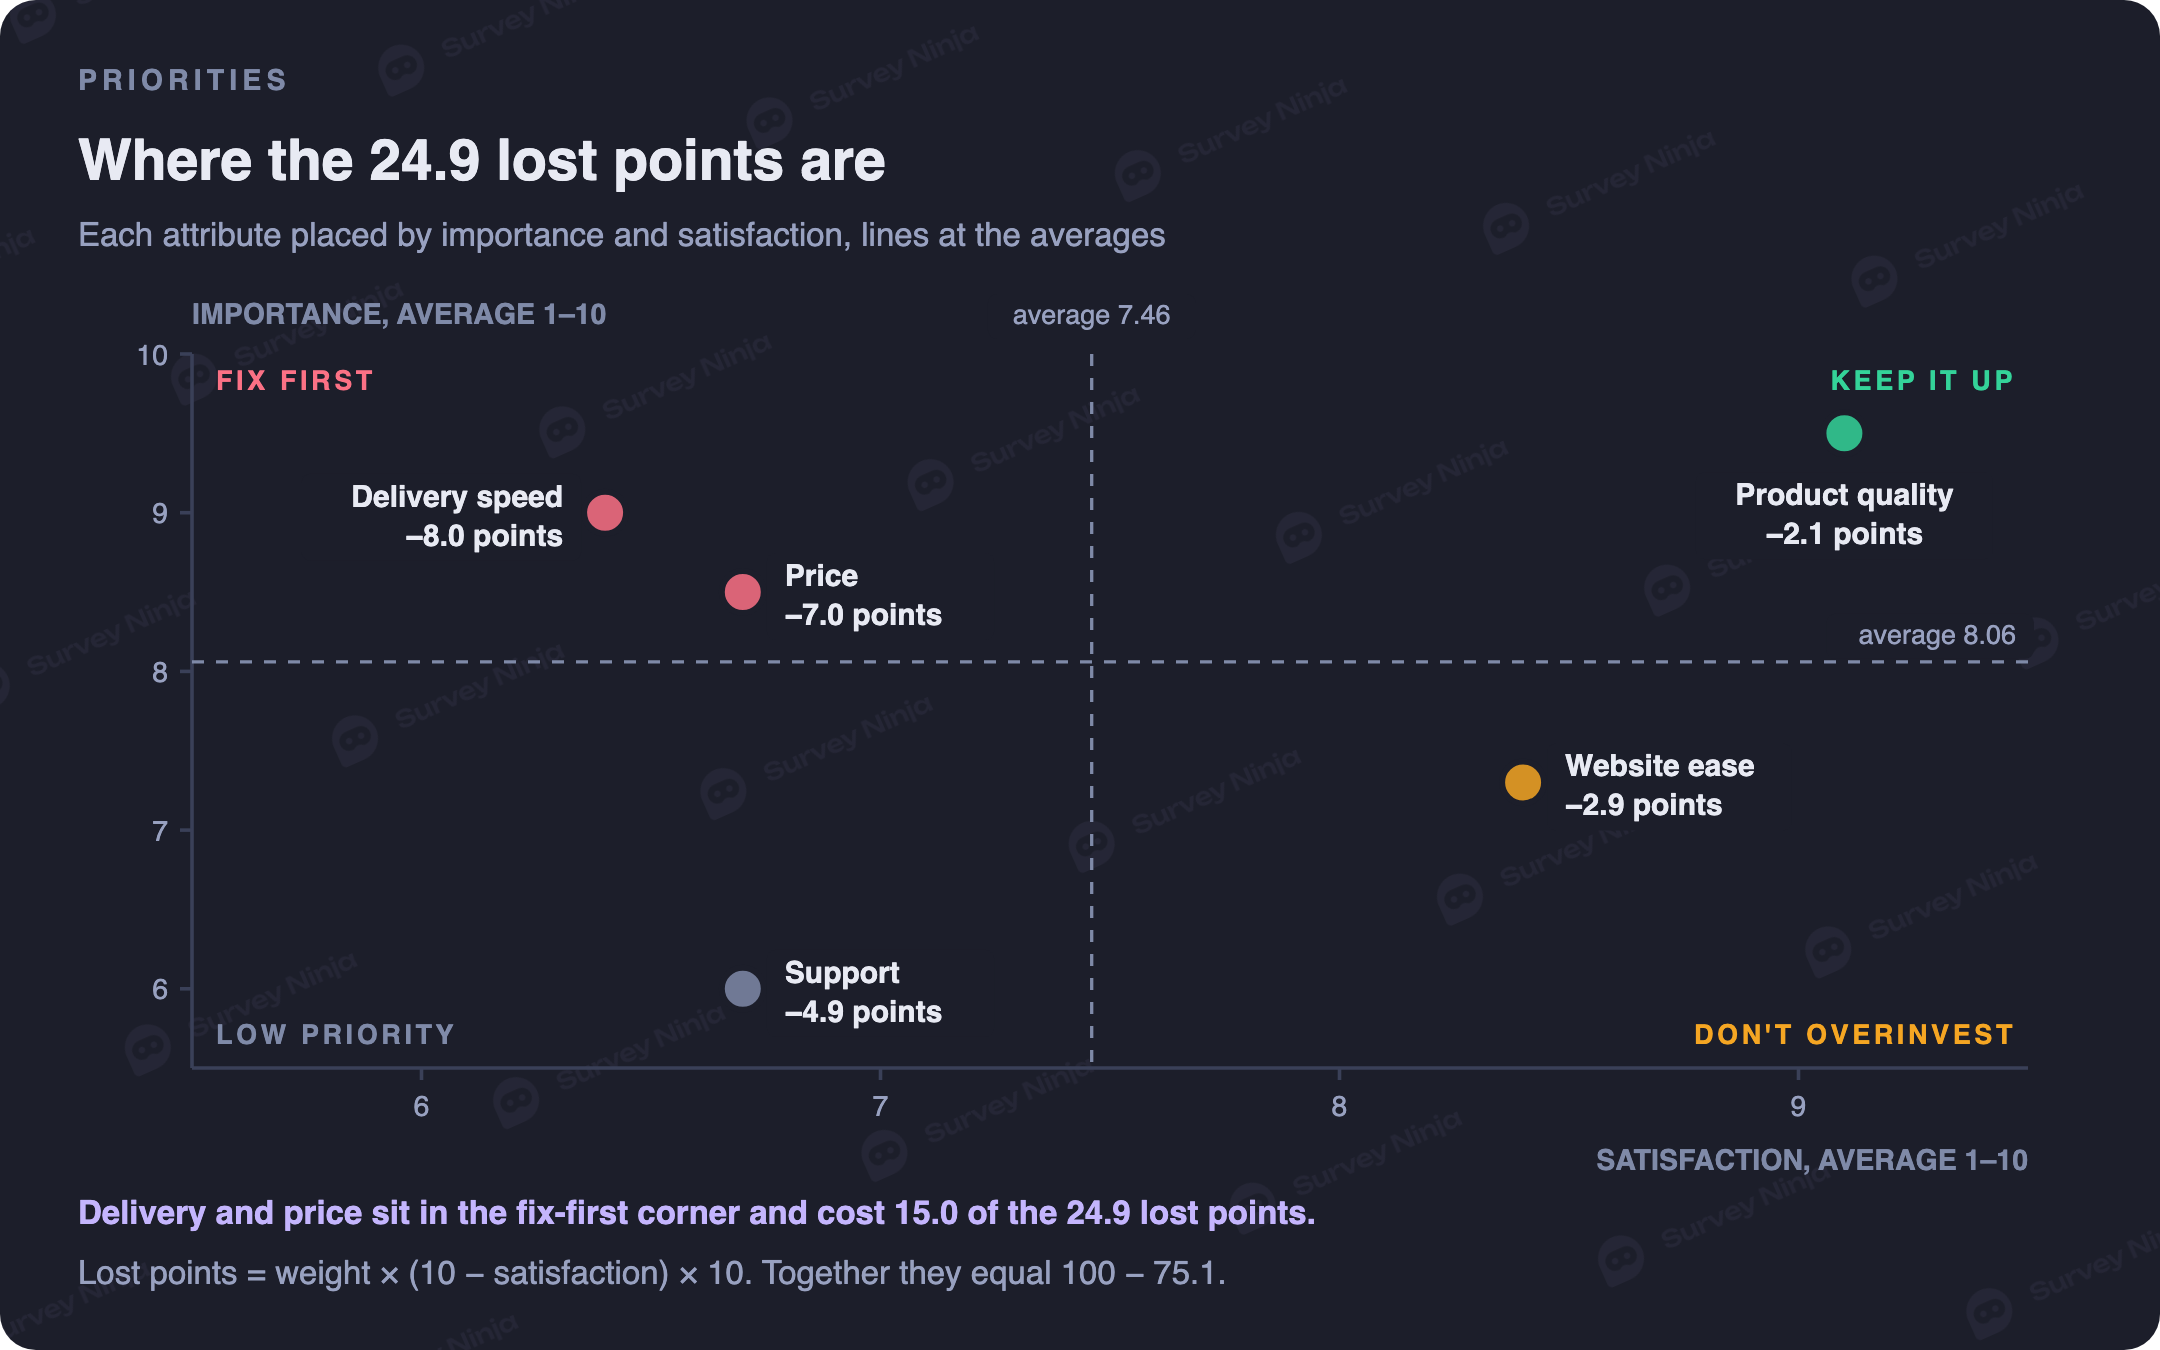
In the example the two readings agree on the top. Delivery speed and price sit in the fix-first corner and cost 15.0 of the 24.9 lost points. If satisfaction with delivery rose from 6.4 to 8.0, the index would gain about 3.6 points. Support is the interesting case. The matrix puts it in the low-priority corner, because its importance is below average. Yet it still costs 4.9 points, more than website ease or product quality, because satisfaction with it is low. The matrix compares attributes with each other, while lost points measure the absolute damage. Read both before you set priorities.
The website shows the opposite risk. Customers are very satisfied with it and rate it below average in importance, so more money spent there is unlikely to move the index.
How ACSI measures satisfaction
The American Customer Satisfaction Index started in 1994 at the University of Michigan, together with the American Society for Quality and CFI Group. Its model grew out of the Swedish Customer Satisfaction Barometer, created in 1989 by Claes Fornell and colleagues.
ACSI does not ask about attributes. It asks three satisfaction questions on 1–10 scales: overall satisfaction, how the experience compared with expectations and how it compared with an ideal product or service. A statistical model combines them with estimated weights and rescales the result to 0–100. The same model measures what drives satisfaction, namely customer expectations, perceived quality and perceived value, and what follows from it: complaints and loyalty.
Two things are worth borrowing for your own surveys: the three-question satisfaction core and the 0–100 rescaling. The econometric model itself needs large samples and specialist work. Remember the limits of comparison too. A homemade CSI of 75 and an ACSI score of 75 come from different questions and formulas, so one is not a benchmark for the other.
What is a good CSI score
There is no universal norm. The result depends on the scale, the attributes, the rescaling and the industry, so a number from another company tells you little about yours. The comparisons that hold are internal: the same attributes, scale and formula across waves, store locations, regions or customer types.
Keep an eye on segment sizes. Averages from small segments jump around between waves, so compare segments only when each has enough answers. Once or twice a year is a reasonable rhythm for CSI, because the survey is long and importance changes slowly. Between waves, a short CSAT or CES survey after individual interactions keeps the picture current.
CSI or CSAT
| CSI | CSAT | |
|---|---|---|
| Questions | Two per attribute plus one overall | One |
| Shows | Which parts of the service drive satisfaction | How satisfied people are with one interaction or overall |
| How often | Once or twice a year | After interactions, continuously |
| Best for | Deciding where to invest | Monitoring and alerts on low scores |
The two work as a pair. CSI tells you what to fix, and CSAT tells you whether the fix is holding week to week. The CSAT calculator turns raw answers into a score, and the CSAT use case shows how to send it automatically after each interaction.
Common mistakes with CSI
- Attributes chosen in a meeting instead of from customer language.
- Double attributes such as "fast and friendly support".
- No "does not apply" option, so people rate things they never used.
- Changing the attributes, the scale or the rescaling between waves.
- Reporting only the index and hiding the attribute breakdown.
- Comparing a homemade CSI with published ACSI scores.
- Running the full study so often that respondents burn out.
How to run a CSI survey in SurveyNinja
Build the importance block and the satisfaction block as two matrix questions with the attributes as rows and a 1–10 scale as columns, then add the overall satisfaction question at the end. If you sell through stores or a website, a ready template such as the supermarket satisfaction survey gives you a starting list of attributes to adapt. Send the survey to your customer list by email, put a QR code at the counter or embed it on the site. Filters and crosstabs split the results by segment, and the XLSX or CSV export gives you the attribute averages to calculate the weights and the index in a spreadsheet. The customer feedback use case shows how teams combine CSI with ongoing feedback, and you can start building for free.
Frequently asked questions
What is a customer satisfaction index (CSI)?
It is a single score that combines customer satisfaction with several attributes of a product or service, each weighted by how important it is to customers. It shows both the overall level of satisfaction and which attributes pull it down.
How do you calculate CSI?
Average the importance and satisfaction scores for each attribute, turn the importance averages into weights that add up to 100%, multiply each satisfaction average by its weight, add the results, divide by the top of the scale and multiply by 100. In the worked example in this guide, the result is 75.1.
What questions are in a CSI survey?
Two questions per attribute on the same scale, one about importance and one about satisfaction, plus one overall satisfaction question at the end. A "does not apply" option keeps people from rating attributes they have not experienced.
What is a good CSI score?
There is no universal benchmark, because the score depends on the attributes, the scale and the formula. Compare the index with your own earlier waves and across your own segments, measured the same way each time.
What is the difference between CSI and CSAT?
CSAT is one satisfaction question, usually asked after an interaction. CSI asks about satisfaction and importance for several attributes, so it shows which parts of the service drive satisfaction and where to invest first.
How is the ACSI calculated?
ACSI asks three questions on 1–10 scales: overall satisfaction, comparison with expectations and comparison with an ideal. A statistical model weights the answers and rescales them to a 0–100 index. It has run in the United States since 1994.
Published: Oct 1, 2026