


Which Customer Metric Should You Actually Use
Useful  Mike Taylor Updated: Sep 18, 2026 Reading time ≈ 26 min

Ask which customer metric is best and you get four acronyms and no decision. The real question is narrower: what will the number change, who has to act on it, and when in the customer's life can you actually ask.
Most explainers on NPS, CSAT, CES and CSI stop at the formula. Promoters minus detractors, the average of a five point scale, a weighted index, and you are left exactly where you started, staring at four names with no way to pick between them. This piece works the other way. Start with the job you need done, and the metric mostly picks itself.
We will not re teach the NPS calculation here, or repeat the case for CSAT over NPS, or run through why NPS gets criticized as a lone board metric. Those live in our guides to NPS, CSAT vs NPS and is NPS outdated. What follows is the part none of those three cover: the decision itself, the timing that matters more than the choice, and CSI, the one metric on this list that nobody explains properly.
Answer these three questions before you compare metrics
Skip the acronyms for a minute. Three questions decide which metric you need, and they have nothing to do with which one sounds most scientific.
What decision will this number change? A metric that does not feed a decision is decoration. If a low score should trigger a support callback, you need a metric that fires per interaction. If a falling number should trigger a strategy review at the executive level, you need one that moves slowly and rarely. Write the decision down before you write the question.
Who owns the number and has to act on it? Every metric needs an owner with the authority to change the thing it measures. A support lead can fix what a CSAT score after a ticket reveals. A product team can fix what a CSI attribute breakdown reveals. Nobody owns "the customer relationship" in the abstract, which is exactly why a slow relationship metric like NPS belongs at the executive level, not buried in a single team's dashboard.
At what moment in the customer's life can you actually ask? Some questions only make sense right after something happens: a ticket closes, a purchase completes, an onboarding flow ends. Others only make sense outside of any single event, asked periodically to someone with enough history to answer honestly. Trying to ask a relationship question at a transactional moment, or the reverse, is the single most common way teams break their own data.
Answer those three and you will usually land on one of four metrics without needing a comparison chart. The next section works through the mechanics, job by job.
From the job to the metric, not the other way around
Nobody wakes up needing "an NPS score." They need to know if a specific ticket went well, or they need a number the board will actually look at, or they need to know what to fix in the product first. State the job in plain language and the right metric usually falls out of it.
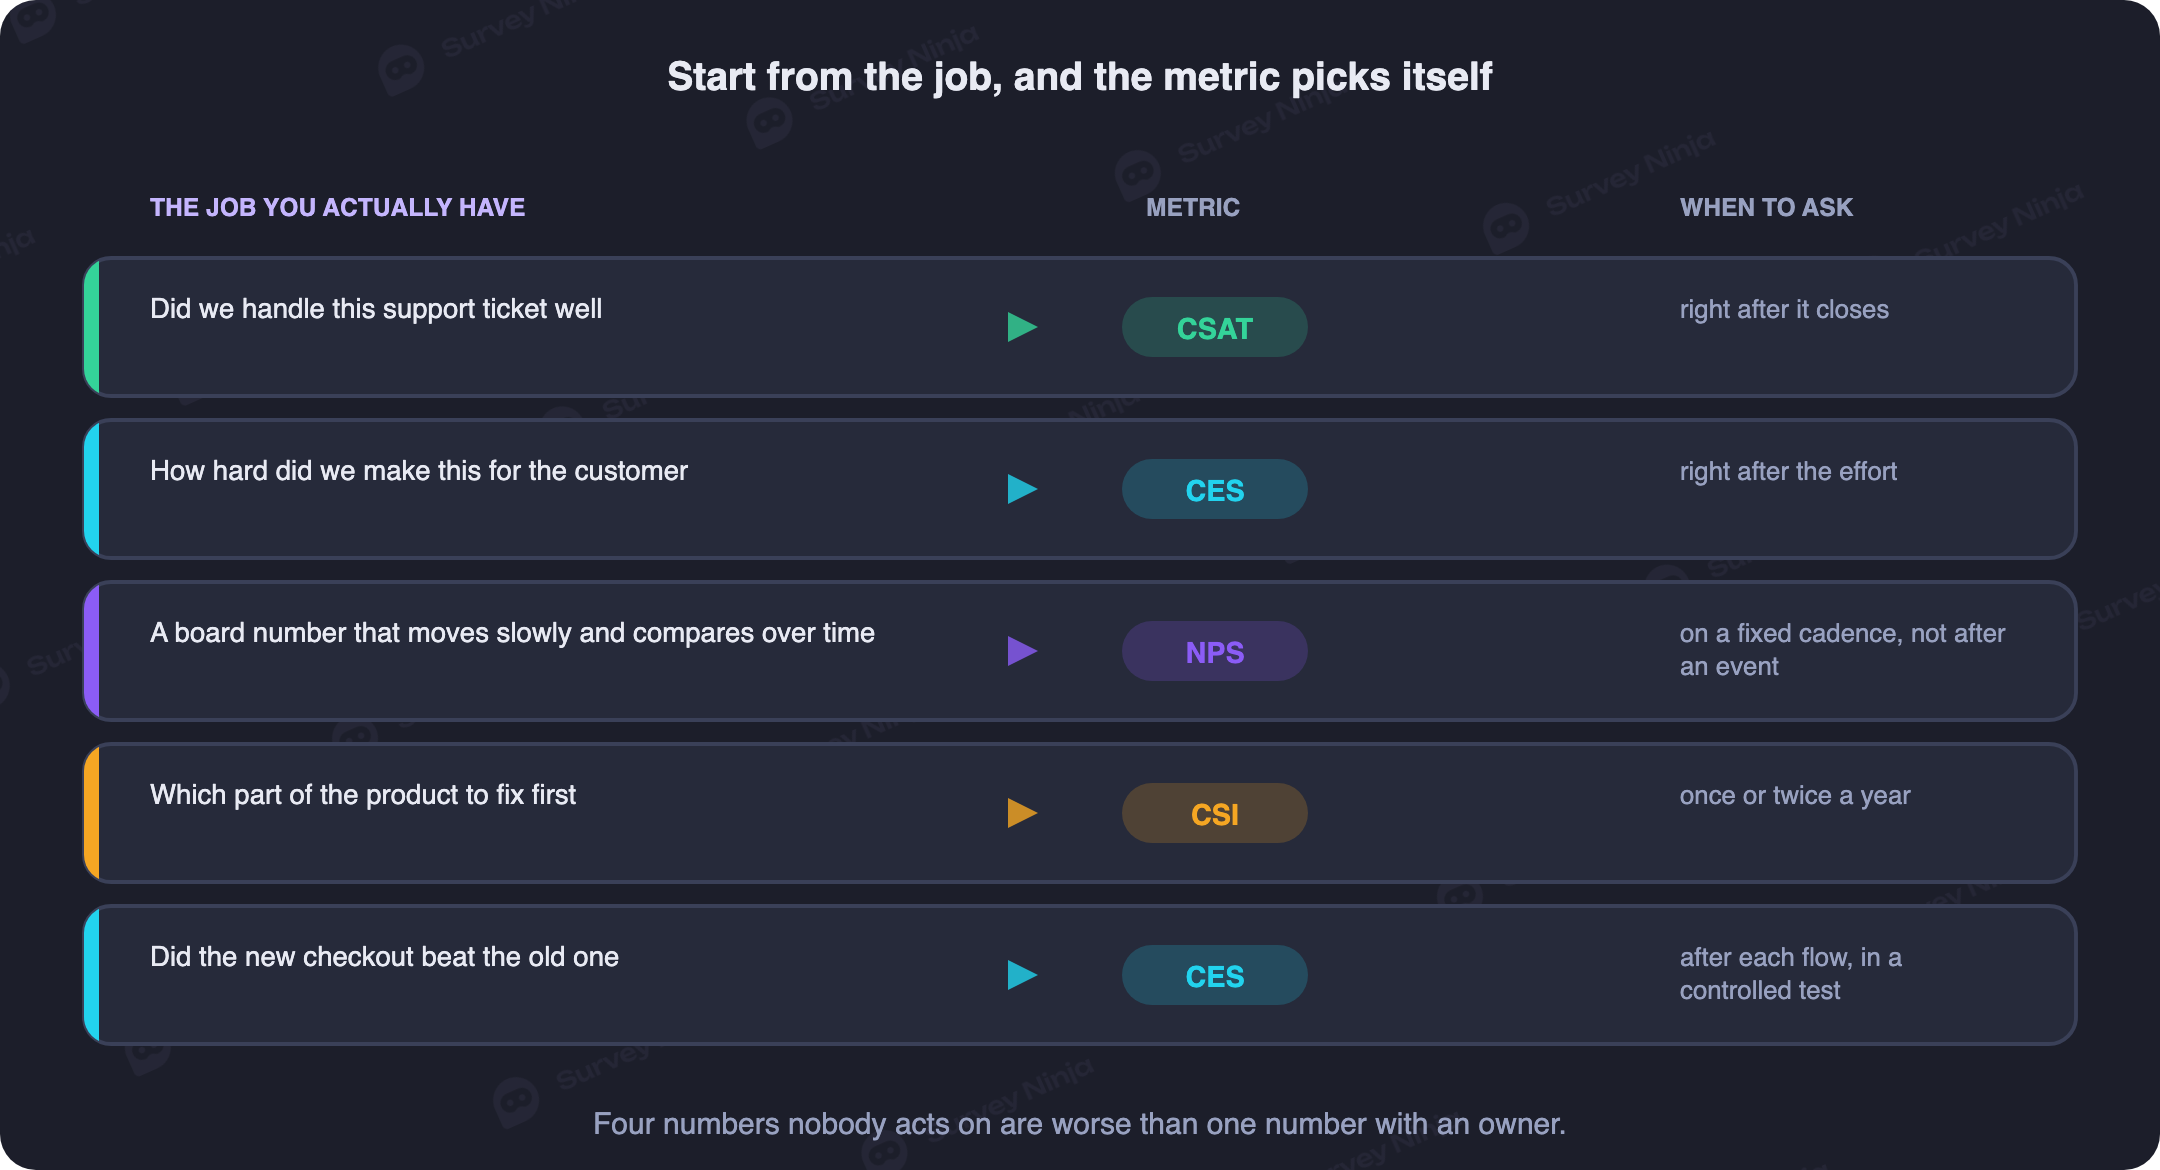
Take five jobs teams actually have. "We want to know if the support ticket was handled well" is a satisfaction question about one closed interaction, which is precisely what CSAT was built for. "We want a board level number that moves slowly" describes a relationship metric asked outside of any single event, which is NPS, and only NPS, because nothing else on this list is designed to sit still for a quarter. "We want to find what to fix in the product first" is a prioritization job, not a satisfaction job, and that is what CSI answers by scoring several attributes on both satisfaction and importance at once. "We want to predict churn" and "we want to compare two checkout flows" both turn out to be the same job wearing different clothes: how much work did the customer have to do, which is the customer effort question, CES.
Notice that effort based CES shows up twice in that list. That is not a mistake. A checkout flow and a support resolution are both tasks with a start and an end, and CES was built to measure exactly that shape of experience regardless of what the task happens to be. If your job description sounds like "did this take more effort than it should have," you are already answering in CES terms even before you pick a scale.
| The job | Metric | When to ask | What you get |
|---|---|---|---|
| Was this ticket handled well | CSAT | Minutes after the ticket closes | A satisfaction reading for that one interaction |
| A board level number that moves slowly | NPS | Quarterly or twice a year, outside any single event | A slow moving relationship trend across the whole base |
| What to fix in the product first | CSI | Once or twice a year, longer survey | A ranked list of attributes by satisfaction gap and importance |
| Will this customer churn | CES | Right after a task or support resolution, tracked over time | An effort trend that moves before churn does |
| Which of two checkout flows is better | CES | Immediately after each flow, in a controlled test | A comparable effort score between two designs |
Read the table as a lookup, not as a ranking. None of these five metrics outranks the others in general, and the same company can be running all four at once without contradiction, because each one is answering a question the others were never asked.
What each one actually measures
Here is the short version of what each metric captures, without re running the arithmetic that our dedicated guides already cover in full.
NPS measures a relationship, not a moment. The question, how likely are you to recommend us, asks a customer to stake a little social capital on your brand, and that willingness accumulates across every interaction they have ever had with you. It is slow by design and blunt by design, and both of those are features when the job is a board level trend rather than a diagnosis.
CSAT measures satisfaction with one specific interaction that just happened. It has no memory of last quarter and no opinion about the brand as a whole. It asks, right now, about this purchase, this call, this delivery, and that narrowness is what makes it fast to move and easy to act on.
CES measures how much work the customer had to do. Not how they feel about you, but how hard the task was: how many steps, how many repeats, how many times they had to explain themselves again. Effort is a proxy for friction, and friction is one of the few things a team can go fix directly, tomorrow, without touching the brand at all.
CSI is different in kind from the other three. It is a composite: you pick several attributes of the experience, score each one for satisfaction and for importance, and combine the two into a single index per attribute. Where the other three give you one number about one thing, CSI gives you a ranked list of things, and that list is the whole point. We cover how to build one further down.
Timing decides more than the metric you pick
Here is the part that gets less attention than the choice of acronym, and it should get more. Ask the wrong metric at the wrong moment and even the correct metric gives you garbage.
A transactional metric asked a week late does not measure the experience. It measures memory, and memory is generous to itself and forgetful of small friction. Send a CSAT survey seven days after a support call and you are mostly asking, how do you feel about us in general right now, which is a different question wearing a CSAT label. The fix is blunt: fire the CSAT or CES prompt within minutes of the interaction ending, while the details are still there to report.
The reverse mistake is just as common and does more damage. A relationship metric asked right after a support call measures the support call, not the relationship. If someone just had a bad experience with your product and you ask them in the same breath how likely they are to recommend you to a friend, you have contaminated a slow moving number with one loud, recent event. NPS needs distance from any single interaction to mean what it claims to mean.
The right moment for each metric follows directly from what it measures. CSAT and CES belong immediately after the thing they are rating: the ticket closing, the checkout completing, the delivery arriving. NPS belongs outside of any of that, sent as its own periodic wave to people who have had time to accumulate an overall impression. CSI belongs on the same periodic cadence as NPS, for a reason we get to in a moment: it is too long to fire off a hundred times a year, and it needs the same kind of settled, whole relationship view that NPS does.
Why "which metric is more accurate" is the wrong question
Teams argue about this constantly, and the argument is a category error. NPS is not a less accurate version of CSAT. CES is not a cruder version of CSI. They measure different things, the way a thermometer and a bathroom scale measure different things, and asking which one is more accurate is like asking whether the thermometer is wrong because it will not tell you your weight.
The confusion usually comes from all four producing a single number that looks the same on a slide. A dash between zero and one hundred, or a plus and minus range, sits in a box on a dashboard and invites comparison with the box next to it. But a CSAT of 85 and an NPS of 45 are not two readings of the same thing at different accuracy levels. One tells you about a support call. The other tells you about a multi year relationship. Neither one validates or contradicts the other, and neither one should.
Here is what actually goes wrong when a company skips this distinction. It ends up running all four badly, because nobody decided which question each one was supposed to answer. NPS gets asked after every interaction, which ruins it as a relationship read. CSAT gets asked once a year, which ruins it as a diagnostic. CSI gets built once and never repeated, so nothing tracks whether the fix worked. The company now has four numbers on a dashboard and zero decisions attached to any of them, which is worse than having one metric run well, because it looks like rigor while producing none.
CSI: build a satisfaction times importance index
CSI is the metric this article exists to explain properly, because almost nothing else does, and it is also the only one of the four that tells you what to fix rather than just how people feel.
Start by picking the attributes. These are the specific things a customer experiences, not vague categories: response time, ease of setup, pricing clarity, the quality of documentation, the reliability of the product under load. Somewhere between six and twelve attributes is workable. Fewer than that and you miss real drivers, more than that and respondents start rushing through the back half of the survey and the data gets noisy exactly where you need it clean.
For each attribute, ask two questions rather than one. How satisfied are you with this, on whatever scale you are using, and separately, how important is this to you. That second question is the entire reason CSI exists. A CSAT style survey can tell you people are unhappy with your documentation, but it cannot tell you whether that unhappiness matters, because it never asked. Maybe nobody reads the documentation and the low score is background noise. CSI asks directly, and the answer changes what you do with the satisfaction number sitting right next to it.
You can get the importance weight two ways. Ask it directly, as its own question per attribute, which is transparent and easy for respondents to answer but leans on people being accurate judges of what actually drives their own behavior, which they often are not. Or derive it statistically, by correlating each attribute's satisfaction score against an overall satisfaction or intent to renew score across your whole respondent pool, and letting the correlation strength stand in for importance. Derived importance is more work and needs a decent sample per attribute to be stable, but it catches attributes people underrate when asked directly, the quiet ones that predict churn without anyone consciously naming them.
Most teams that run CSI well do a bit of both: ask importance directly as a sanity check, and derive it statistically as the number that actually drives prioritization. When the two disagree sharply on one attribute, that disagreement is itself useful information about a blind spot in how customers describe their own priorities.
The priority quadrant CSI hands you
Once you have satisfaction and importance for every attribute, plot them against each other. That single chart is the reason CSI is worth the extra work, because it turns a list of scores into a set of instructions.
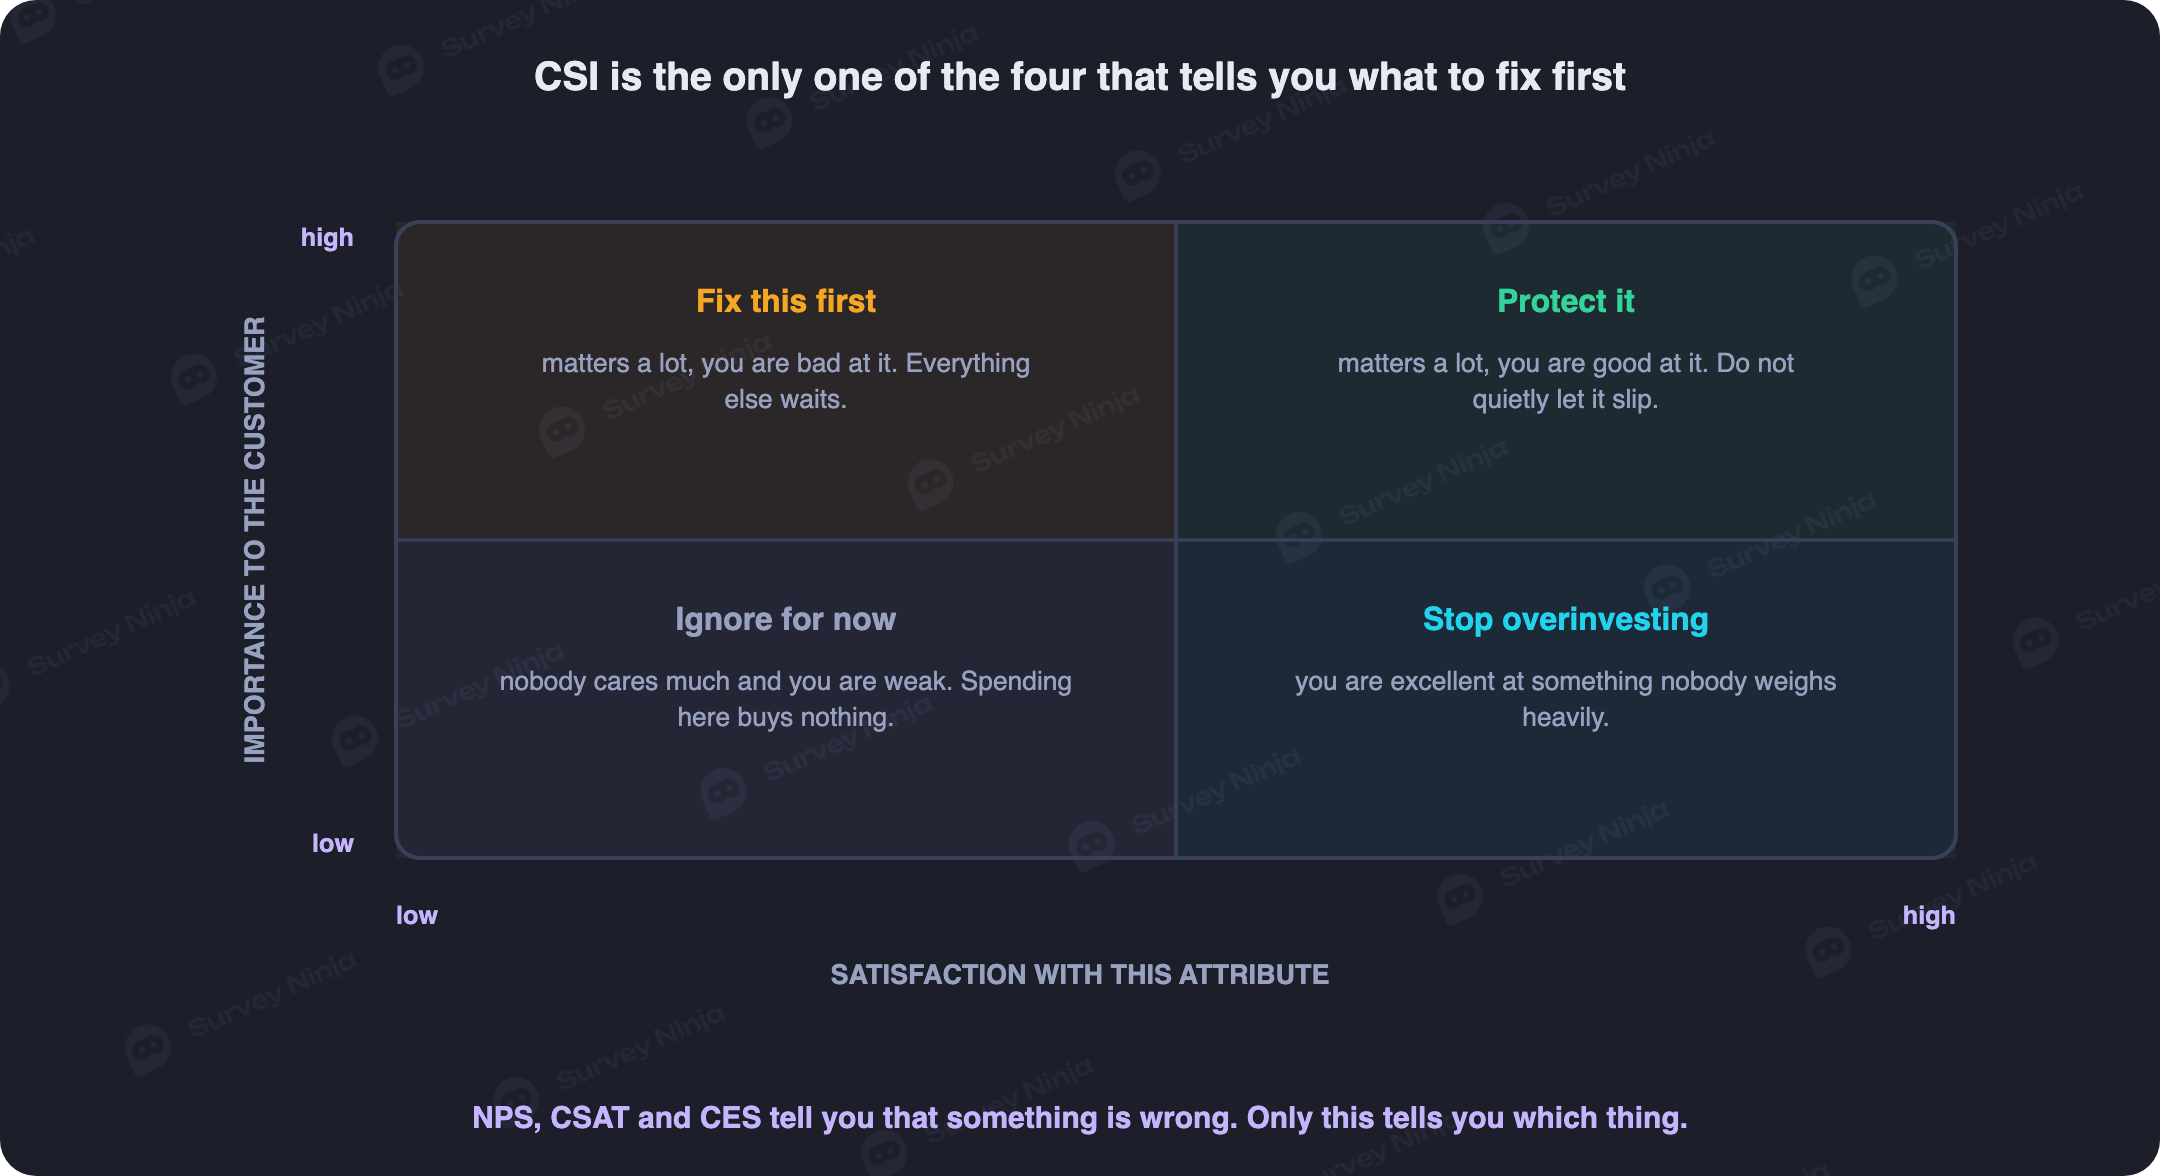
High importance and low satisfaction is your fix first quadrant. These are the attributes customers care about and you are failing at, and they are where a product roadmap should point next, ahead of anything that only shows up as a general complaint. High importance and high satisfaction is your protect quadrant, the things you are doing right that customers actually value, worth defending against a cost cutting decision that looks harmless in isolation. Low importance and high satisfaction is quietly wasted effort, a place your team may be polishing something nobody asked for. Low importance and low satisfaction is the one everyone wants to fix and almost never should, because fixing it moves nothing that customers will notice or reward. That last quadrant is the one CSI saves you from. Without an importance measure, a low satisfaction score on any attribute looks urgent. With it, you can see that some of those urgent looking numbers sit in a corner nobody actually cares about, and route the budget somewhere it will show up in retention instead.
What CSI costs you
None of this is free, and pretending otherwise is how CSI programs die quietly after one wave. A survey asking satisfaction and importance for eight to twelve attributes is long. Respondents feel that length, and completion rates drop as the question count climbs, which is the same mechanism covered in our piece on reducing survey dropout. You cannot shorten it much without losing the attribute coverage that makes the quadrant meaningful, so the honest answer is to accept the length and protect it with a clean, well paced questionnaire rather than pretend you can compress two questions per attribute into one.
The other cost is frequency. You cannot run CSI monthly. Between the length, the respondent fatigue, and the fact that attribute importance genuinely does not shift week to week, a monthly cadence produces noise dressed up as a trend. Twice a year is a reasonable rhythm for most products, once a year for anything slower moving, with the CSAT and CES metrics from your regular touchpoints filling the gaps in between. CSI tells you what to fix. It is not built to tell you whether last week's fix worked, and treating it that way is the fastest way to burn out the survey and the respondents both.
Sample size: why NPS needs more responses than CSAT
The same eleven point scale that makes NPS familiar is also what makes it expensive to trust. NPS asks for a 0 to 10 rating, then throws most of that resolution away by collapsing it into three buckets: promoter, passive, detractor. A six and a zero both count as detractors even though almost nobody would call them the same customer. That collapse discards information CSAT and CES never throw away in the first place, because their scales stay closer to the shape of the final metric. The practical consequence is sample size. A share of promoters minus a share of detractors is noisier, response for response, than a plain average of a five point satisfaction scale, because the bucketing amplifies small shifts near a boundary and flattens real shifts that happen to land inside one bucket. As a rule of thumb, plan for NPS to need meaningfully more responses than CSAT before you trust a modest move in the score, several times as many rather than a similar count, and treat any NPS shift under a double digit swing on a small sample as noise until proven otherwise.
This is not an argument against NPS. It is an argument against reading a three point NPS wobble on forty responses the same way you would read a three point CSAT wobble on the same base. Before you commit to a cadence and a sample, work through the actual numbers for your traffic and response rate with our sample size calculator, because the honest number is almost always higher than the one a dashboard implies by showing a single decimal point of false precision.
Five mistakes in choosing a metric
These are not theoretical. They are the five ways teams most often pick a metric for the wrong reason and pay for it months later.
- Picking NPS because the board recognizes it, then having nobody who can act on it. Recognition is not a reason. If no team owns the customer relationship end to end, a slow moving relationship number just sits there getting reported without ever changing a decision.
- Running a transactional metric on a relationship cadence. Sending a CSAT or CES question once a year, about the relationship in general, turns a precise per interaction signal into a vague opinion poll, and you lose exactly what made the metric useful in the first place.
- Comparing your number to a published industry benchmark collected differently. A benchmark built on a different scale, a different channel, and a different customer base is not comparable to yours, no matter how confidently the report states the number. Compare your own trend against your own history instead.
- Changing the wording or the scale between waves. Move from a 5 point to a 7 point scale, or reword the question even slightly, and the new number is not the same metric anymore, even though it looks identical on the same chart line.
- Tracking a metric nobody has the authority to change. A number with no owner does not stay neutral, it quietly loses credibility, because everyone can see it moves and nobody can explain why, since nobody was ever responsible for making it move on purpose.
Where to start, and what to add later
Treat this as a sequence, not a menu you pick all four items from on day one. Start with a transactional metric at your single highest volume touchpoint, whichever of CSAT or CES fits the shape of that touchpoint better. Support tickets and completed purchases suit CSAT. Checkout, onboarding and account setup suit CES. This is the cheapest metric to run, the fastest to show a signal, and the easiest to hand to one team with the authority to fix what it finds.
Add NPS once you have the volume and the org structure to make a slow relationship number worth reading, and once you have identified who actually owns it at the executive level. Running NPS earlier than that just produces a number people glance at without anyone deciding what a ten point drop should trigger.
Add CSI last, once your transactional metrics are stable enough that you trust the baseline and you are ready to ask a harder question: not how satisfied are people, but what should we build next. CSI is a periodic project, not a standing dashboard tile, and it earns its cost only once you have somewhere concrete to send the answer, a roadmap review or a planning cycle that can actually act on a fix first quadrant.
Which article to read next
Each of these four points somewhere more specific than this overview. Pick based on the metric you landed on.
If you landed on NPS, our Net Promoter Score guide covers the calculation and how to word the question properly. Read is NPS outdated next if you are worried about putting all your trust in one relationship number, since it lays out exactly where NPS falls short and what to run alongside it.
If you landed on CSAT, our CSAT vs NPS piece runs the head to head argument in full, including when CSAT beats NPS outright and when it does not.
If you landed on CES, look at in-app feedback for the mechanics of firing an effort question at the exact right moment inside a product, and triggered surveys for setting up the event based trigger behind it.
If you landed on CSI, types of surveys and question types covers how to word a paired satisfaction and importance question well, and the sample size calculator tells you how many responses your periodic wave actually needs before the priority quadrant can be trusted.
Frequently asked questions
Which customer metric should I use, NPS, CSAT, CES or CSI?
It depends on the decision the number needs to feed. Use CSAT for satisfaction with one closed interaction, CES for how much effort a task took, NPS for a slow board level relationship trend, and CSI when you need a ranked list of what to fix in the product first. Most companies eventually run more than one, each answering a different question.
What is the main difference between NPS, CSAT and CES?
NPS measures a relationship and a willingness to recommend, accumulated across every interaction a customer has ever had. CSAT measures satisfaction with one specific interaction that just happened. CES measures how much work the customer had to do to get something done. They answer different questions rather than competing versions of the same one.
What does CSI measure that the other three don't?
CSI is a composite index. It scores several attributes of the experience for both satisfaction and importance, then combines the two so you can see not just what people are unhappy with, but which of those unhappy attributes actually matter to them. NPS, CSAT and CES each give a single number about one dimension. CSI gives a ranked, prioritized list.
When should I ask a CSAT or CES question instead of an NPS question?
Ask CSAT or CES within minutes of the interaction ending, while the details are fresh: right after a ticket closes, a purchase completes, or a task finishes. Ask NPS outside of any single event, on its own periodic schedule, to someone with enough history with you to answer a relationship question honestly.
Why does NPS need more responses than CSAT to mean anything?
NPS collapses an eleven point 0 to 10 scale into three buckets, promoter, passive and detractor, which throws away resolution that CSAT's plainer average keeps. As a rule of thumb, plan for NPS to need several times the responses CSAT needs before you can trust a modest move in the score, and use a sample size calculator rather than a guess.
Can I run CSI every month like a pulse survey?
No. CSI is long by design, since it asks two questions per attribute across six to twelve attributes, and attribute importance does not shift week to week anyway. Twice a year is a workable rhythm for most products. Use your CSAT and CES metrics to fill the gaps between CSI waves.
Is one of these four metrics more accurate than the others?
No, and the question itself is the mistake. They measure different things, the way a thermometer and a scale measure different things. A company that skips this distinction ends up running all four badly, with four numbers on a dashboard and no decisions attached to any of them.
What is the biggest mistake companies make when picking a metric?
Picking NPS because the board recognizes the name, then discovering nobody owns the customer relationship well enough to act on it. Close behind that is running a transactional metric like CSAT on a yearly relationship cadence, which turns a precise signal into a vague opinion that nobody can use.
How do I get the importance weight for each CSI attribute?
Two ways, and the strongest programs use both. Ask importance directly, as its own question per attribute, which is transparent but leans on people accurately judging their own priorities. Or derive it statistically by correlating each attribute's satisfaction with an overall score across your respondent pool, which catches attributes people underrate when asked directly.
Updated: Sep 18, 2026 Published: Aug 29, 2026