


Rating Scale Examples: Labels for 1–5, 1–7, 1–10 and 0–10 Scales
Useful  Mike Taylor Oct 13, 2026 Reading time ≈ 13 min

A rating scale asks people to place their answer on an ordered set of points: from poor to excellent, from never to always, from 1 to 10. The numbers matter less than the words attached to them. Below are ready label sets for the most common scales, descriptions for a 1–10 scale and the rules for choosing between them.
For the definition and the difference between rating and Likert scales, see our glossary entry on the rating scale. For agreement scales in depth, read our Likert scale guide. This page is the practical part: what to put on each point.
Unipolar or bipolar: decide this first
Some scales measure how much of something there is: how often, how important, how good. They start at nothing and grow, so they are unipolar. Others measure a direction: satisfied or dissatisfied, agree or disagree, likely or unlikely. They run between two opposites with a neutral middle, so they are bipolar.
Get this wrong and no label set will rescue the question. The difference shapes the scale. In a review of survey research, Pasek and Krosnick (2010) note that ratings tend to be more reliable and valid with five points for unipolar dimensions and seven points for bipolar ones. The same review recommends a verbal label on every point. Words make the meaning of each point clear, while numbers alone leave each respondent to guess what a 3 means.
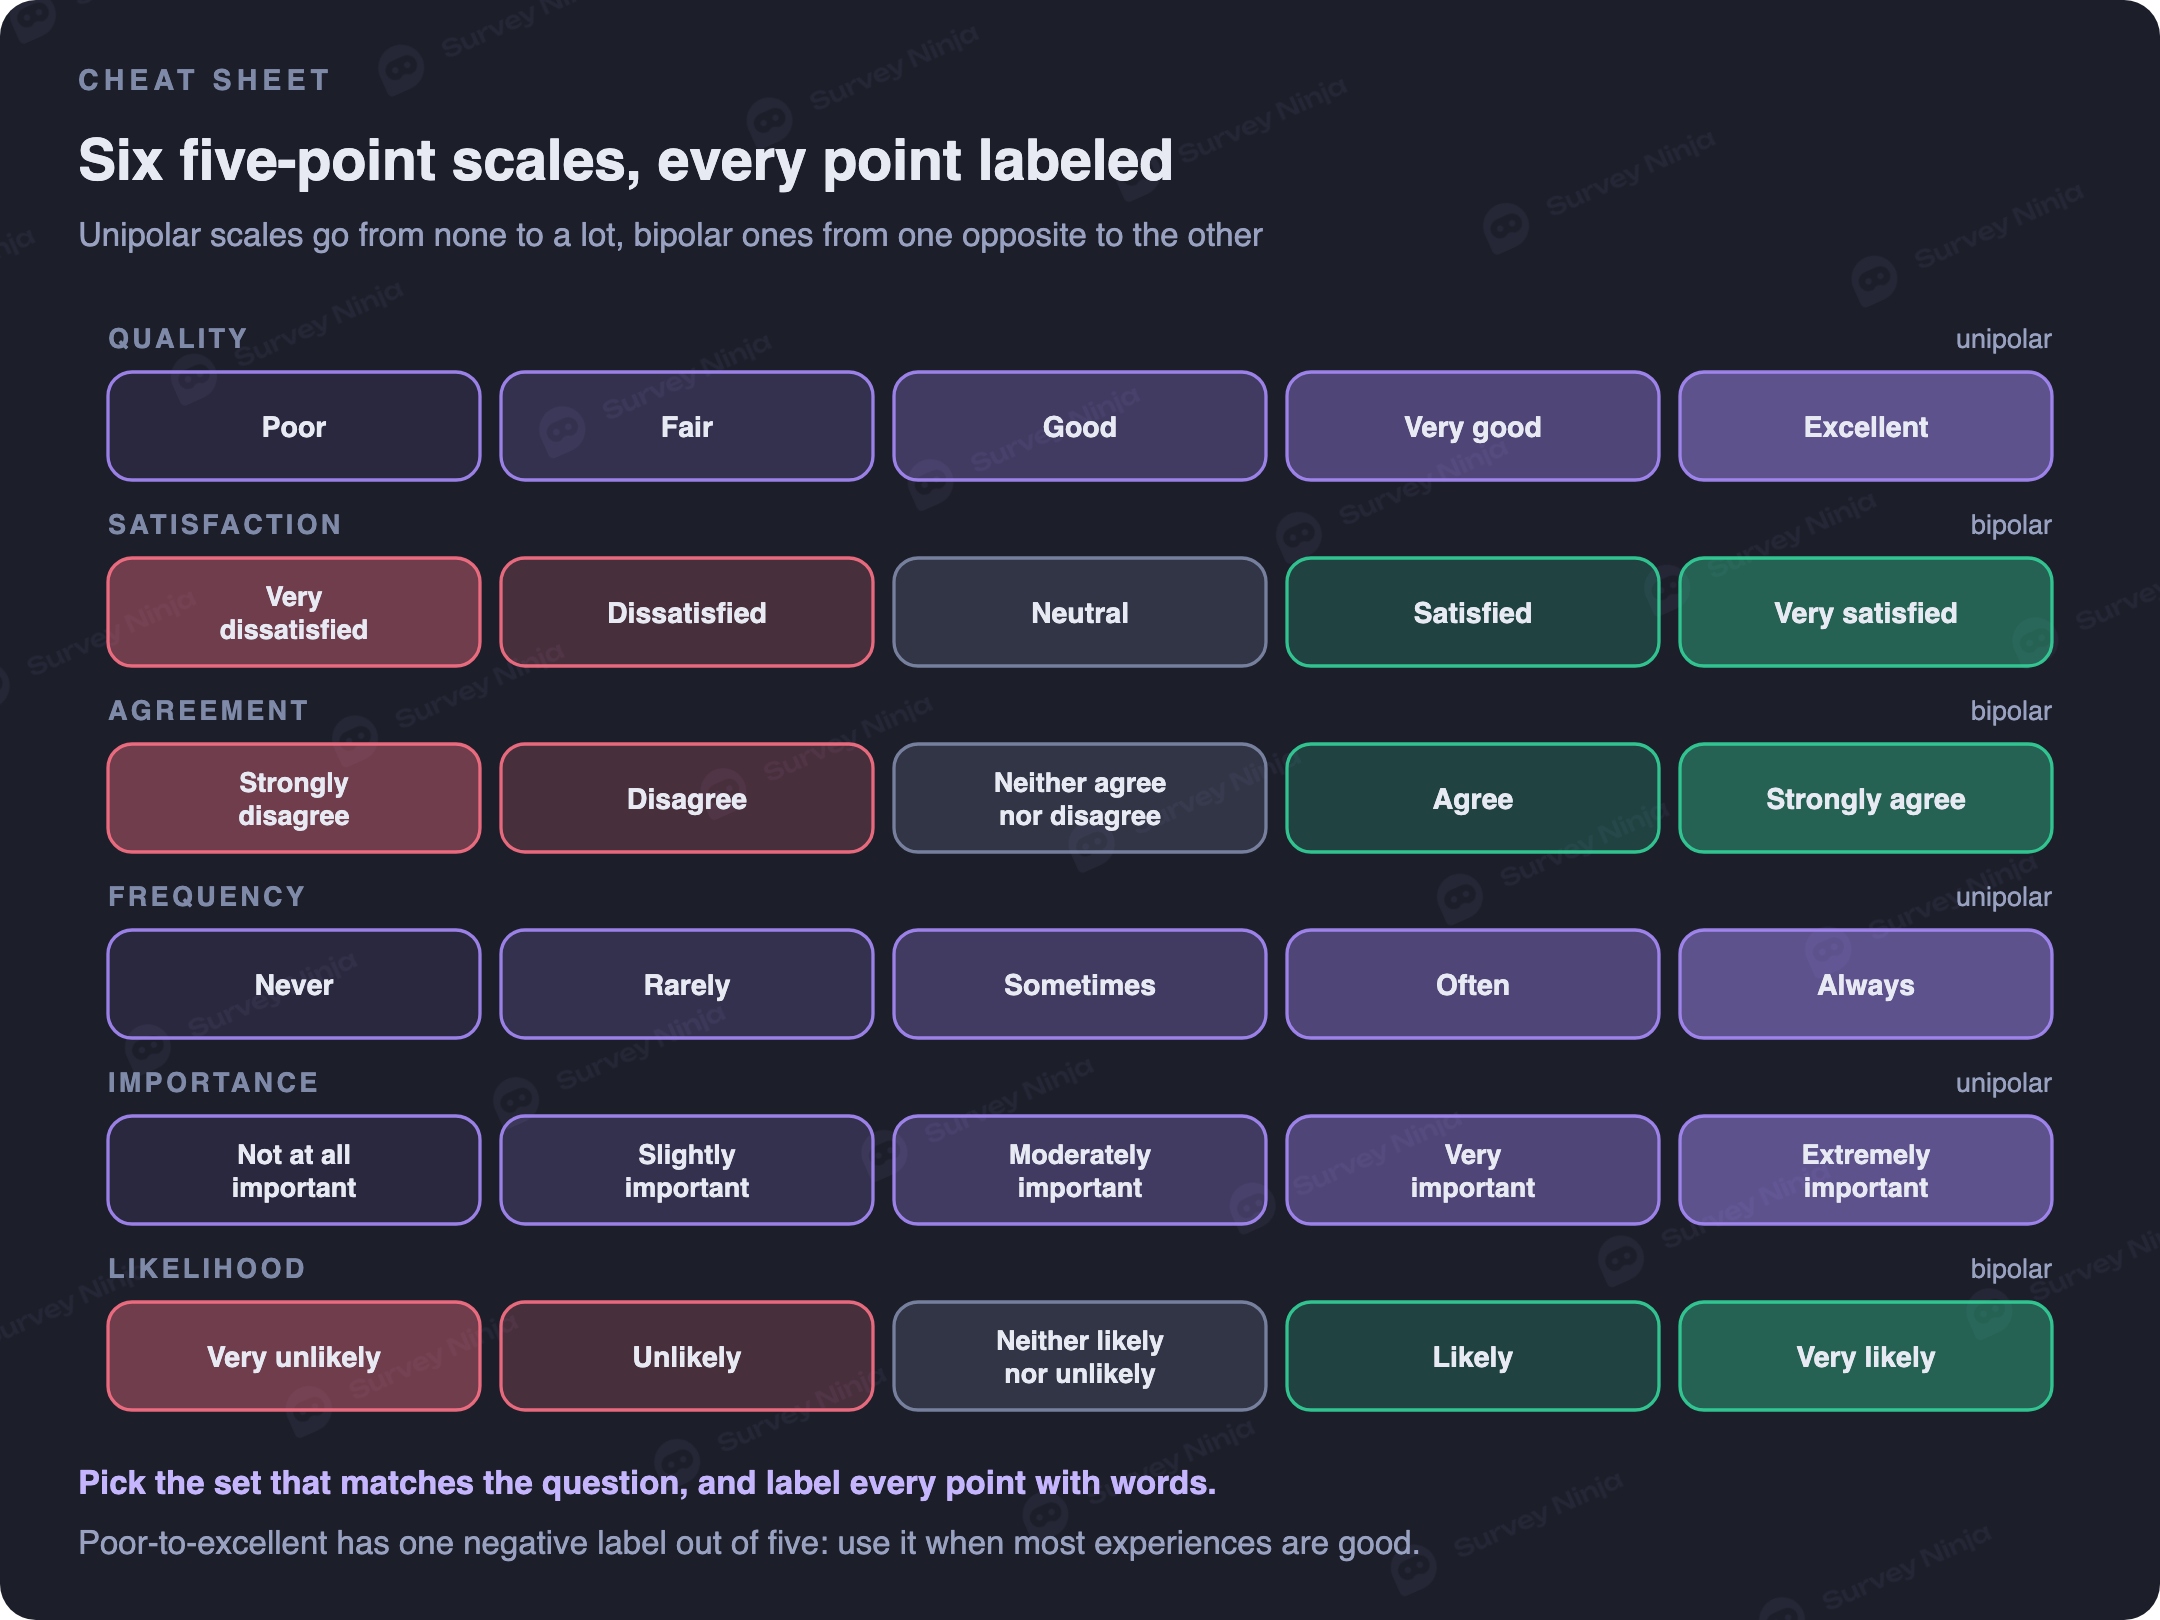
1–5 rating scale examples
These label sets cover most survey questions. Use one per question, keep its wording and order identical across the survey, and keep the positive end on the same side every time.
- Quality: Poor · Fair · Good · Very good · Excellent
- Quality, balanced: Very poor · Poor · Fair · Good · Excellent
- Satisfaction: Very dissatisfied · Dissatisfied · Neither satisfied nor dissatisfied · Satisfied · Very satisfied
- Agreement: Strongly disagree · Disagree · Neither agree nor disagree · Agree · Strongly agree
- Frequency: Never · Rarely · Sometimes · Often · Always
- Importance: Not at all important · Slightly important · Moderately important · Very important · Extremely important
- Likelihood: Very unlikely · Unlikely · Neither likely nor unlikely · Likely · Very likely
- Ease: Very difficult · Difficult · Neither easy nor difficult · Easy · Very easy
- Performance: Unsatisfactory · Needs improvement · Meets expectations · Exceeds expectations · Outstanding
A word on the most searched set, poor to excellent. It is lopsided. Out of five labels, one is negative and three are positive. That makes it good at telling "good" from "excellent" when most experiences are positive, and weak at measuring how bad a bad experience was. If unhappy customers matter as much as happy ones, use the balanced version. The same review by Pasek and Krosnick makes the general point: the labels on a scale should be equally spaced in meaning.
Rating scale question examples
A scale only works when the question asks for what the labels measure. Here is how questions and scales pair up in practice:
- How would you rate the quality of our support today? Poor to excellent.
- How satisfied are you with your delivery? Very dissatisfied to very satisfied.
- How often do you use the reports feature? Never to always.
- How important is price when you choose a supplier? Not at all important to extremely important.
- How likely are you to buy from us again? Very unlikely to very likely.
- How easy was it to find what you needed? Very difficult to very easy.
- "The training will help me in my daily work." Strongly disagree to strongly agree.
- How would you rate this employee's communication? Unsatisfactory to outstanding.
- How likely are you to recommend us to a friend or colleague? 0 to 10, labeled at both ends.
Notice what the pairs have in common. The question names one thing, and the scale measures one quality of it. "How satisfied are you with the speed and friendliness of our staff?" fails both tests, because it asks about two things and no label can answer both at once.
1–7 scales for bipolar questions
When a question has two opposite ends, seven points leave room for a "slightly" on each side:
- Satisfaction: Very dissatisfied · Dissatisfied · Slightly dissatisfied · Neither satisfied nor dissatisfied · Slightly satisfied · Satisfied · Very satisfied
- Agreement: Strongly disagree · Disagree · Somewhat disagree · Neither agree nor disagree · Somewhat agree · Agree · Strongly agree
- Liking: Dislike a great deal · Dislike moderately · Dislike slightly · Neither like nor dislike · Like slightly · Like moderately · Like a great deal
The seven-point agreement scale is also the format of the revised customer effort score, as our guide to customer effort score explains. On a phone, seven labeled options read better as a vertical list than as a row of buttons.
1–10 rating scale descriptions
Ten points are familiar from "rate it out of ten", but hard to label. Krosnick and Presser (2010) observe that finding a distinct word for every point gets harder as a scale grows beyond seven points. The usual solution is to label only the two ends, for example "1 = very poor" and "10 = excellent". If you want a word for every number, use a set like this one, and show it to respondents rather than keeping it in a report legend:
| Score | Label |
|---|---|
| 1 | Terrible |
| 2 | Very poor |
| 3 | Poor |
| 4 | Below average |
| 5 | Average |
| 6 | Above average |
| 7 | Good |
| 8 | Very good |
| 9 | Excellent |
| 10 | Exceptional |
One trap with 1–10: it has an even number of points, so there is no exact middle. Five is not the center. The center lies between 5 and 6, yet many people still read 5 as "neutral" and answer accordingly. If you need a true middle, use 0–10 or an odd number of points.
The 0–10 scale
The 0–10 scale has eleven points and a real middle at 5. It is the format of the Net Promoter Score question, labeled only at the ends: 0 means "not at all likely" and 10 "extremely likely". Use it when you need fine distinctions or want your results to line up with NPS. The NPS calculator turns the answers into a score. For most other questions, a labeled five- or seven-point scale is quicker and clearer to answer.
Should a rating scale have a neutral middle?
An odd number of points gives a midpoint, and an even number forces a lean. The evidence leans toward keeping the midpoint. In a study cited by Krosnick and Presser (2010), O'Muircheartaigh and colleagues (1999) found that adding a midpoint improved the reliability and validity of ratings. Without it, people who belonged in the middle picked one of the moderate points nearby at random.
Keep "don't know" and "not applicable" outside the scale, as separate options at the end. Otherwise a person with no opinion lands on "neutral", and the two answers become impossible to tell apart.
How to convert between 1–5, 1–10 and 0–100
To compare answers from different scales, bring them to a common 0–100 range: (score − lowest point) ÷ (highest point − lowest point) × 100. This is the rescaling formula that Preston and Colman (2000) used and Dawes (2008) adapted.
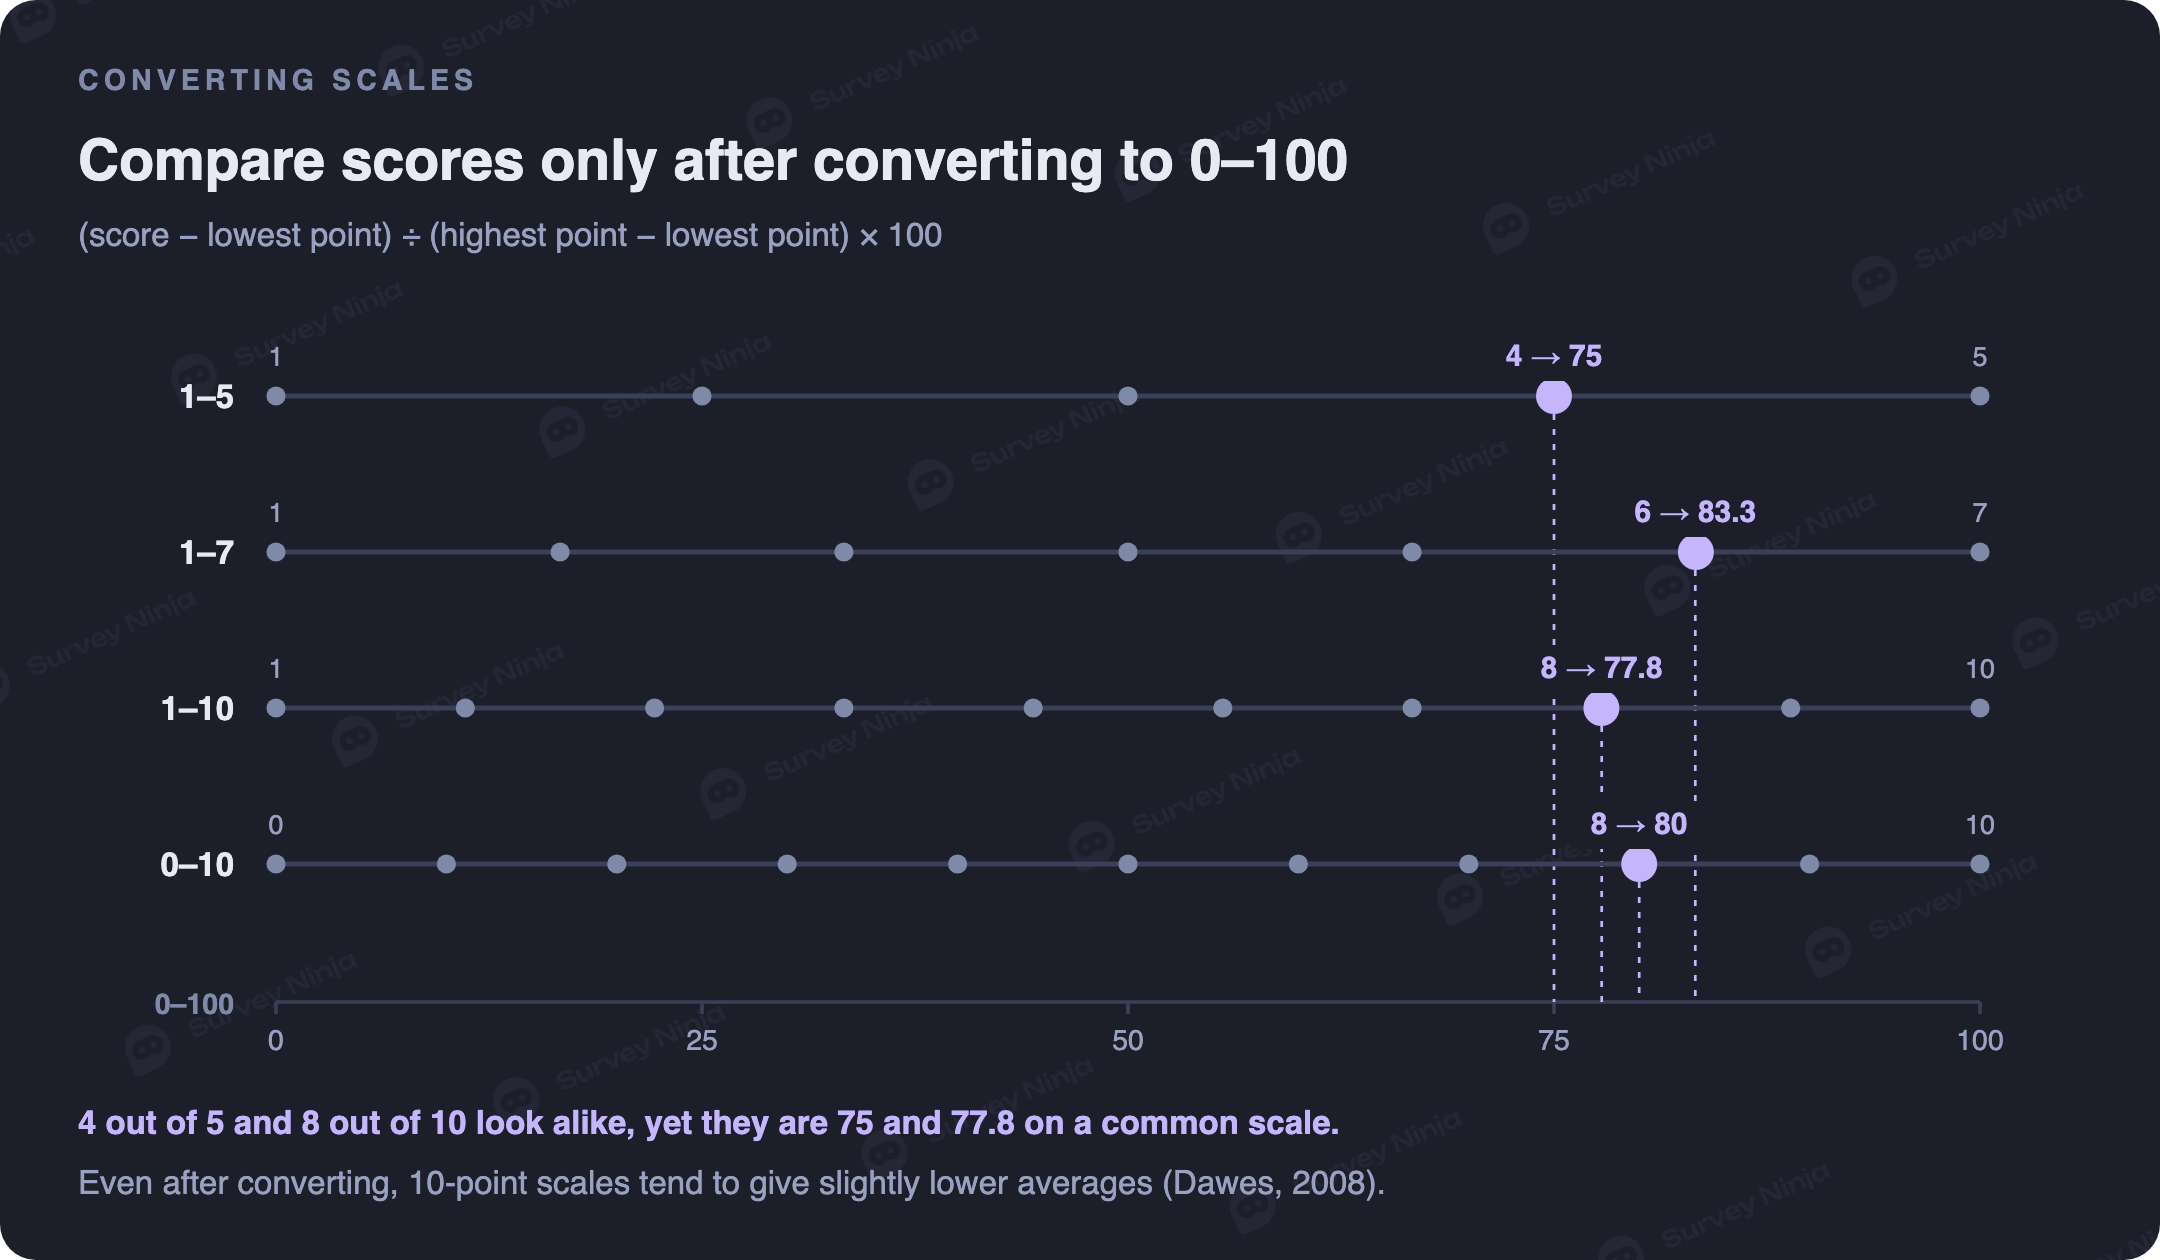
So 4 on a 1–5 scale becomes 75, 8 on a 1–10 scale becomes 77.8 and 8 on a 0–10 scale becomes 80. To convert a 1–5 score straight to a 1–10 scale, use 1 + (score − 1) × 9 ÷ 4: a 4 becomes 7.75, not 8.
Converted scores are comparable. They are not identical. In Dawes's experiment, 5-point and 7-point scales gave the same average once converted, while the 10-point version came out about 0.3 points lower on a ten-point basis. Don't splice a 1–5 history and a 1–10 present into one trend line without marking where the scale changed.
How to report rating scale results
Report three things, in this order of usefulness. First the distribution, meaning how many people chose each point. Then the share at the top, such as the share of 4 and 5 answers on a five-point scale, known as the top-2-box score. Then the average. The share is easy to explain and hard to distort, while the average hides how many people sat at the bottom of the scale.
The top-box calculator and the CSAT calculator compute the shares from raw counts. To compare them between groups, such as new and returning customers, see our guide to cross-tabulation in surveys.
Numbers, stars or emoji
The same five points can look like numbers, stars, emoji or plain word buttons. Each format suits a different job.
- Stars are familiar from product reviews and app stores. They work for quick quality ratings, but they carry no words, so add a label to at least the first and last star.
- Emoji fit one-question pulses inside an app or at a counter, where speed matters more than precision. Faces from frowning to smiling read as a satisfaction scale, so don't put them under a frequency or importance question.
- Word buttons are the clearest choice for anything you will analyze seriously. They spell out each point, which is exactly what the research on labeling recommends.
- Numbers alone belong only to familiar formats like 0–10, and even there the ends need words.
Whatever you choose, keep it. A score collected with stars this quarter and with numbered buttons the next is not the same measurement.
Common mistakes with rating scales
- Numbers without words, so "1 to 5" means something different to every respondent.
- An unbalanced set like poor to excellent used to measure dissatisfaction.
- Switching direction, so that 5 means excellent in one question and poor in the next.
- Labels that don't match the question, such as an agreement scale under a "how often" question.
- Ten or more labeled buttons in a single row on a phone screen.
- "Not applicable" placed in the middle of the scale.
- Averages from different scales compared without converting them first.
How to build rating scales in SurveyNinja
Use the Scale element. Set the number of points, add a label to each point or only to the ends, and choose how it looks: numbers, stars or buttons. Make it required only for the core question of the survey. Reports show the distribution and the average for every scale question, filters split the results by segment, and the export gives one column per question for further analysis. For ready-made customer feedback questions with suitable scales, see our list of 50 customer satisfaction survey questions. You can start building for free.
Frequently asked questions
What is a 1–5 rating scale?
It is a question with five ordered answer points, such as poor, fair, good, very good and excellent. Each point should carry a word label, so every respondent reads it the same way. Five points suit unipolar questions about how much of something there is.
What are the labels for a 1–5 scale from poor to excellent?
The common set is 1 poor, 2 fair, 3 good, 4 very good and 5 excellent. It has only one negative label, so it suits experiences that are mostly positive. For a balanced version, use very poor, poor, fair, good and excellent.
What do the numbers on a 1–10 rating scale mean?
Only what the labels say. Label at least the two ends, for example 1 very poor and 10 excellent, or give a word to every number, from 1 terrible to 10 exceptional. A 1–10 scale has no exact middle: the center falls between 5 and 6.
Is a 1–5 or a 1–10 rating scale better?
For most survey questions, a fully labeled five-point scale for unipolar questions and a seven-point scale for bipolar ones give the most reliable answers. A 1–10 or 0–10 scale suits questions where people are used to rating out of ten, such as the NPS question.
Should a rating scale have a neutral option?
Usually yes. Research reviewed by Krosnick and Presser found that a midpoint improves the reliability of ratings. Keep "don't know" and "not applicable" as separate options outside the scale.
How do you convert a 1–5 rating to a 1–10 scale?
Use 1 + (score − 1) × 9 ÷ 4, so a 4 becomes 7.75. To compare any scales, convert them to 0–100 with (score − lowest point) ÷ (highest point − lowest point) × 100.
Published: Oct 13, 2026