


How to Cross-Tabulate Survey Results Without Mixing Up Percentages
Useful  Mike Taylor Oct 11, 2026 Reading time ≈ 20 min

Cross-tabulation compares answers across groups, but the denominator decides what a percentage means. This worked customer survey takes you from individual responses to counts, row and column percentages, missing-answer checks and a finding you can explain.
What a survey cross-tab tells you
A cross-tabulation, also called a contingency table, counts the combinations of two categorical variables. Put customer type in the rows and satisfaction in the columns, and each cell tells you how many people belong to that particular combination. The totals around the edges are the marginal totals.
The useful question comes first: are returning customers less satisfied than first-time customers? A cross-tabulation makes that comparison visible, provided the categories and reporting base are clear. A single overall satisfaction percentage would combine the two groups and conceal their different response patterns.
This guide concentrates on denominators and reproducibility. For a broader introduction to frequencies, averages and spread, use descriptive analysis; here, we will reconstruct several views of the same table and account for every excluded record. All example responses are fictional, unweighted and created for this tutorial.
Start with one response per row
Our imaginary retailer asks two single-choice questions: “Was your most recent purchase your first purchase from us?” and “Overall, were you satisfied with your most recent purchase?” The coding is first or returning, followed by yes or no. For simplicity, this teaching example uses a binary satisfaction item rather than a standard multi-point CSAT scale.
An optional follow-up appears to respondents who choose “no”: “Which aspects disappointed you? Select all that apply: price, delivery, support.” The dataset stores each option in its own column. Among people who answered this follow-up, 1 means selected and 0 means not selected; blank values are reserved for skipped or unasked questions.
The complete CSV below contains 108 unique response IDs. Each row represents one survey response, which we assume comes from a different person. In your own study, check repeat submissions before making that assumption and document any deduplication rule. The helper pair_valid is 1 only when both customer type and satisfaction are present.
Keep the original export intact and prepare your analysis in a separate sheet. Consistent data preparation matters because “Returning,” “returning” and a stray trailing space can create different groups in a pivot table. If your questionnaire offered “not sure,” retain and describe that category rather than silently recoding it as “no.”
Build counts before percentages
Restrict the first table to the 100 records with pair_valid=1. There are 40 first-time customers and 60 returning customers; 50 report satisfaction and 50 do not. The counts are small enough to reconcile directly against the CSV:
| Customer | Yes | No | Base |
|---|---|---|---|
| First purchase | 28 | 12 | 40 |
| Returning | 22 | 38 | 60 |
| Total | 50 | 50 | 100 |
The upper-left cell contains 28 first-time customers who answered “yes.” It is the numerator for all three calculations below, but its denominator changes with the question. Labeling a report only “satisfaction by customer type, %” leaves the reader to guess which calculation you used.
Before formatting, check both directions: 28 + 12 = 40 and 22 + 38 = 60; 28 + 22 = 50 and 12 + 38 = 50. All four interior cells sum to 100. A total of 108 here would mean missing values have entered the table through a different rule, which you would need to explain.
Row percentages compare outcomes within groups
To ask whether first-time customers are more satisfied, divide each cell by its row total. First-time customers give 28/40 = 70.0% satisfied and 12/40 = 30.0% dissatisfied. Returning customers give 22/60 = 36.7% satisfied and 38/60 = 63.3% dissatisfied, rounded to one decimal place.
Each row sums to 100%, apart from rounding. That is the direction you need for a customer satisfaction comparison: both groups get their own base, so their different sample sizes do not determine the apparent satisfaction rate. Compare 70.0% with 36.7%, while displaying the underlying 28/40 and 22/60.
The gap is 33.3 percentage points, calculated from the unrounded rates before rounding the result. Describe it in percentage points, since “33.3% more satisfied” would imply a relative calculation. If a row total is zero, its percentage is undefined; show an unavailable result instead of presenting 0% as an observed rate.
Column and total percentages answer other questions
Column percentages describe the composition of an outcome. Among the 50 satisfied respondents, 28/50 = 56.0% are first-time customers and 22/50 = 44.0% are returning customers. Among the 50 dissatisfied respondents, the split is 24.0% first-time and 76.0% returning, so each outcome column sums to 100%.
Use this view when planning a follow-up with dissatisfied respondents. It tells you where those respondents came from, while row percentages tell you how common dissatisfaction was within each customer group. The 76.0% figure alone does not establish that returning customers have a 76.0% dissatisfaction rate.
Total percentages divide by the 100 paired responses. The four interior cells become 28.0%, 12.0%, 22.0% and 38.0%, which together sum to 100%. This view describes how the entire analyzed sample is distributed across combinations, and it can help explain how much of that sample occupies a particular cell.
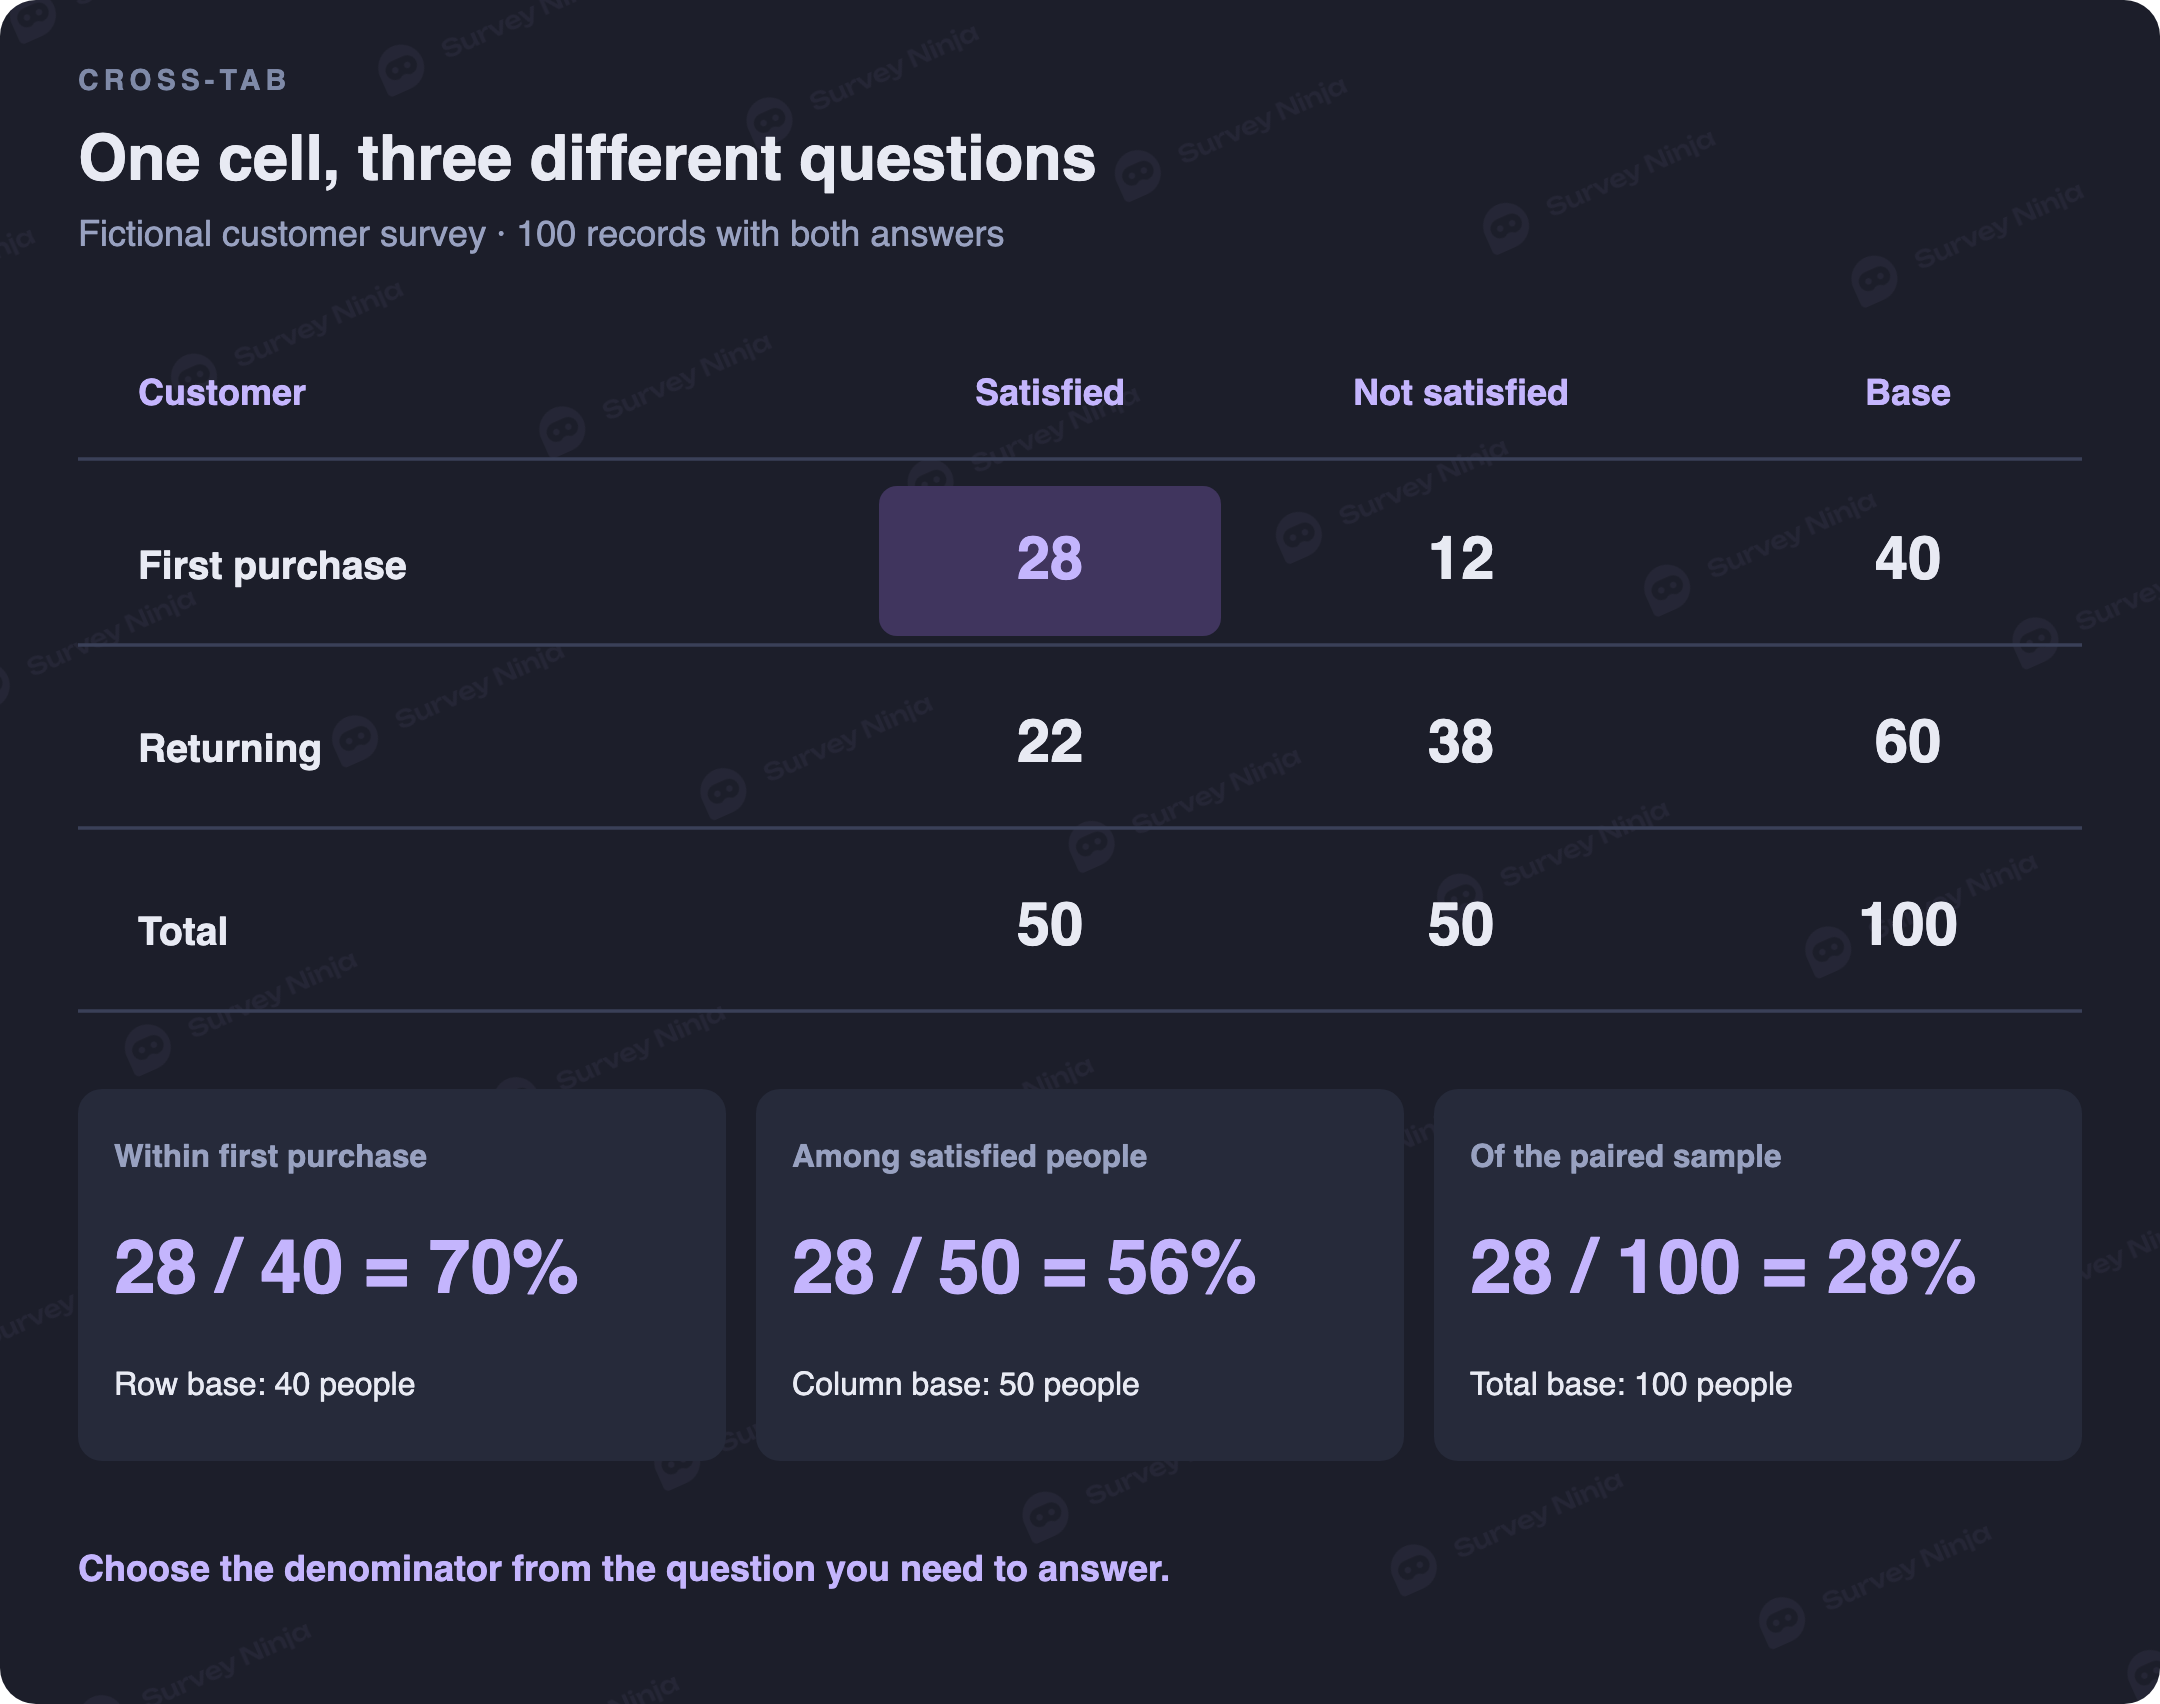
The three percentages are all correct. Trouble begins when one is used to answer another question, or when adjacent charts switch denominators without saying so. Choose the view before designing the chart and place its base beside the percentage.
Account for missing answers without double-counting
Eight of the 108 records cannot enter the main cross-tab: four lack customer type only, three lack satisfaction only, and one lacks both. These mutually exclusive categories reconcile as 108 − 4 − 3 − 1 = 100. You can inspect them in the CSV by filtering pair_valid=0.
Counting blank fields separately gives five missing customer-type values and four missing satisfaction values. Subtracting both numbers from 108 would produce 99 because the respondent missing both fields gets subtracted twice. A paired-response rule needs a count of excluded people, not the sum of empty cells.
There are 104 valid satisfaction answers across the full dataset, including two “yes” and two “no” records with unknown customer type. Overall satisfaction on that question is therefore 52/104 = 50.0%. Our paired table also happens to yield 50.0%, but its base is 100; this numerical coincidence does not make the populations interchangeable.
Show exclusions in your report and consider whether nonresponse differs by group. For example, the known first-time group has 42 records, of which two lack satisfaction, while the known returning group has 61, of which one lacks it. Excluding missing answers describes respondents who answered both questions, and cannot recover the views of those who did not.
Multiple-answer questions need a respondent base
Now use the same dataset for the follow-up, keeping the 100 paired records as our analysis population. Only the 50 dissatisfied respondents were eligible for this question; four skipped it and 46 selected at least one aspect. The two dissatisfied respondents without customer type remain outside this paired-population analysis.
Among those 46 follow-up respondents, price was selected by 24 people, delivery by 27 and support by 12. Dividing each count by 46 gives 52.2%, 58.7% and 26.1%. Their sum is 137.0% after rounding because one person could select several aspects, producing 63 selections in total.
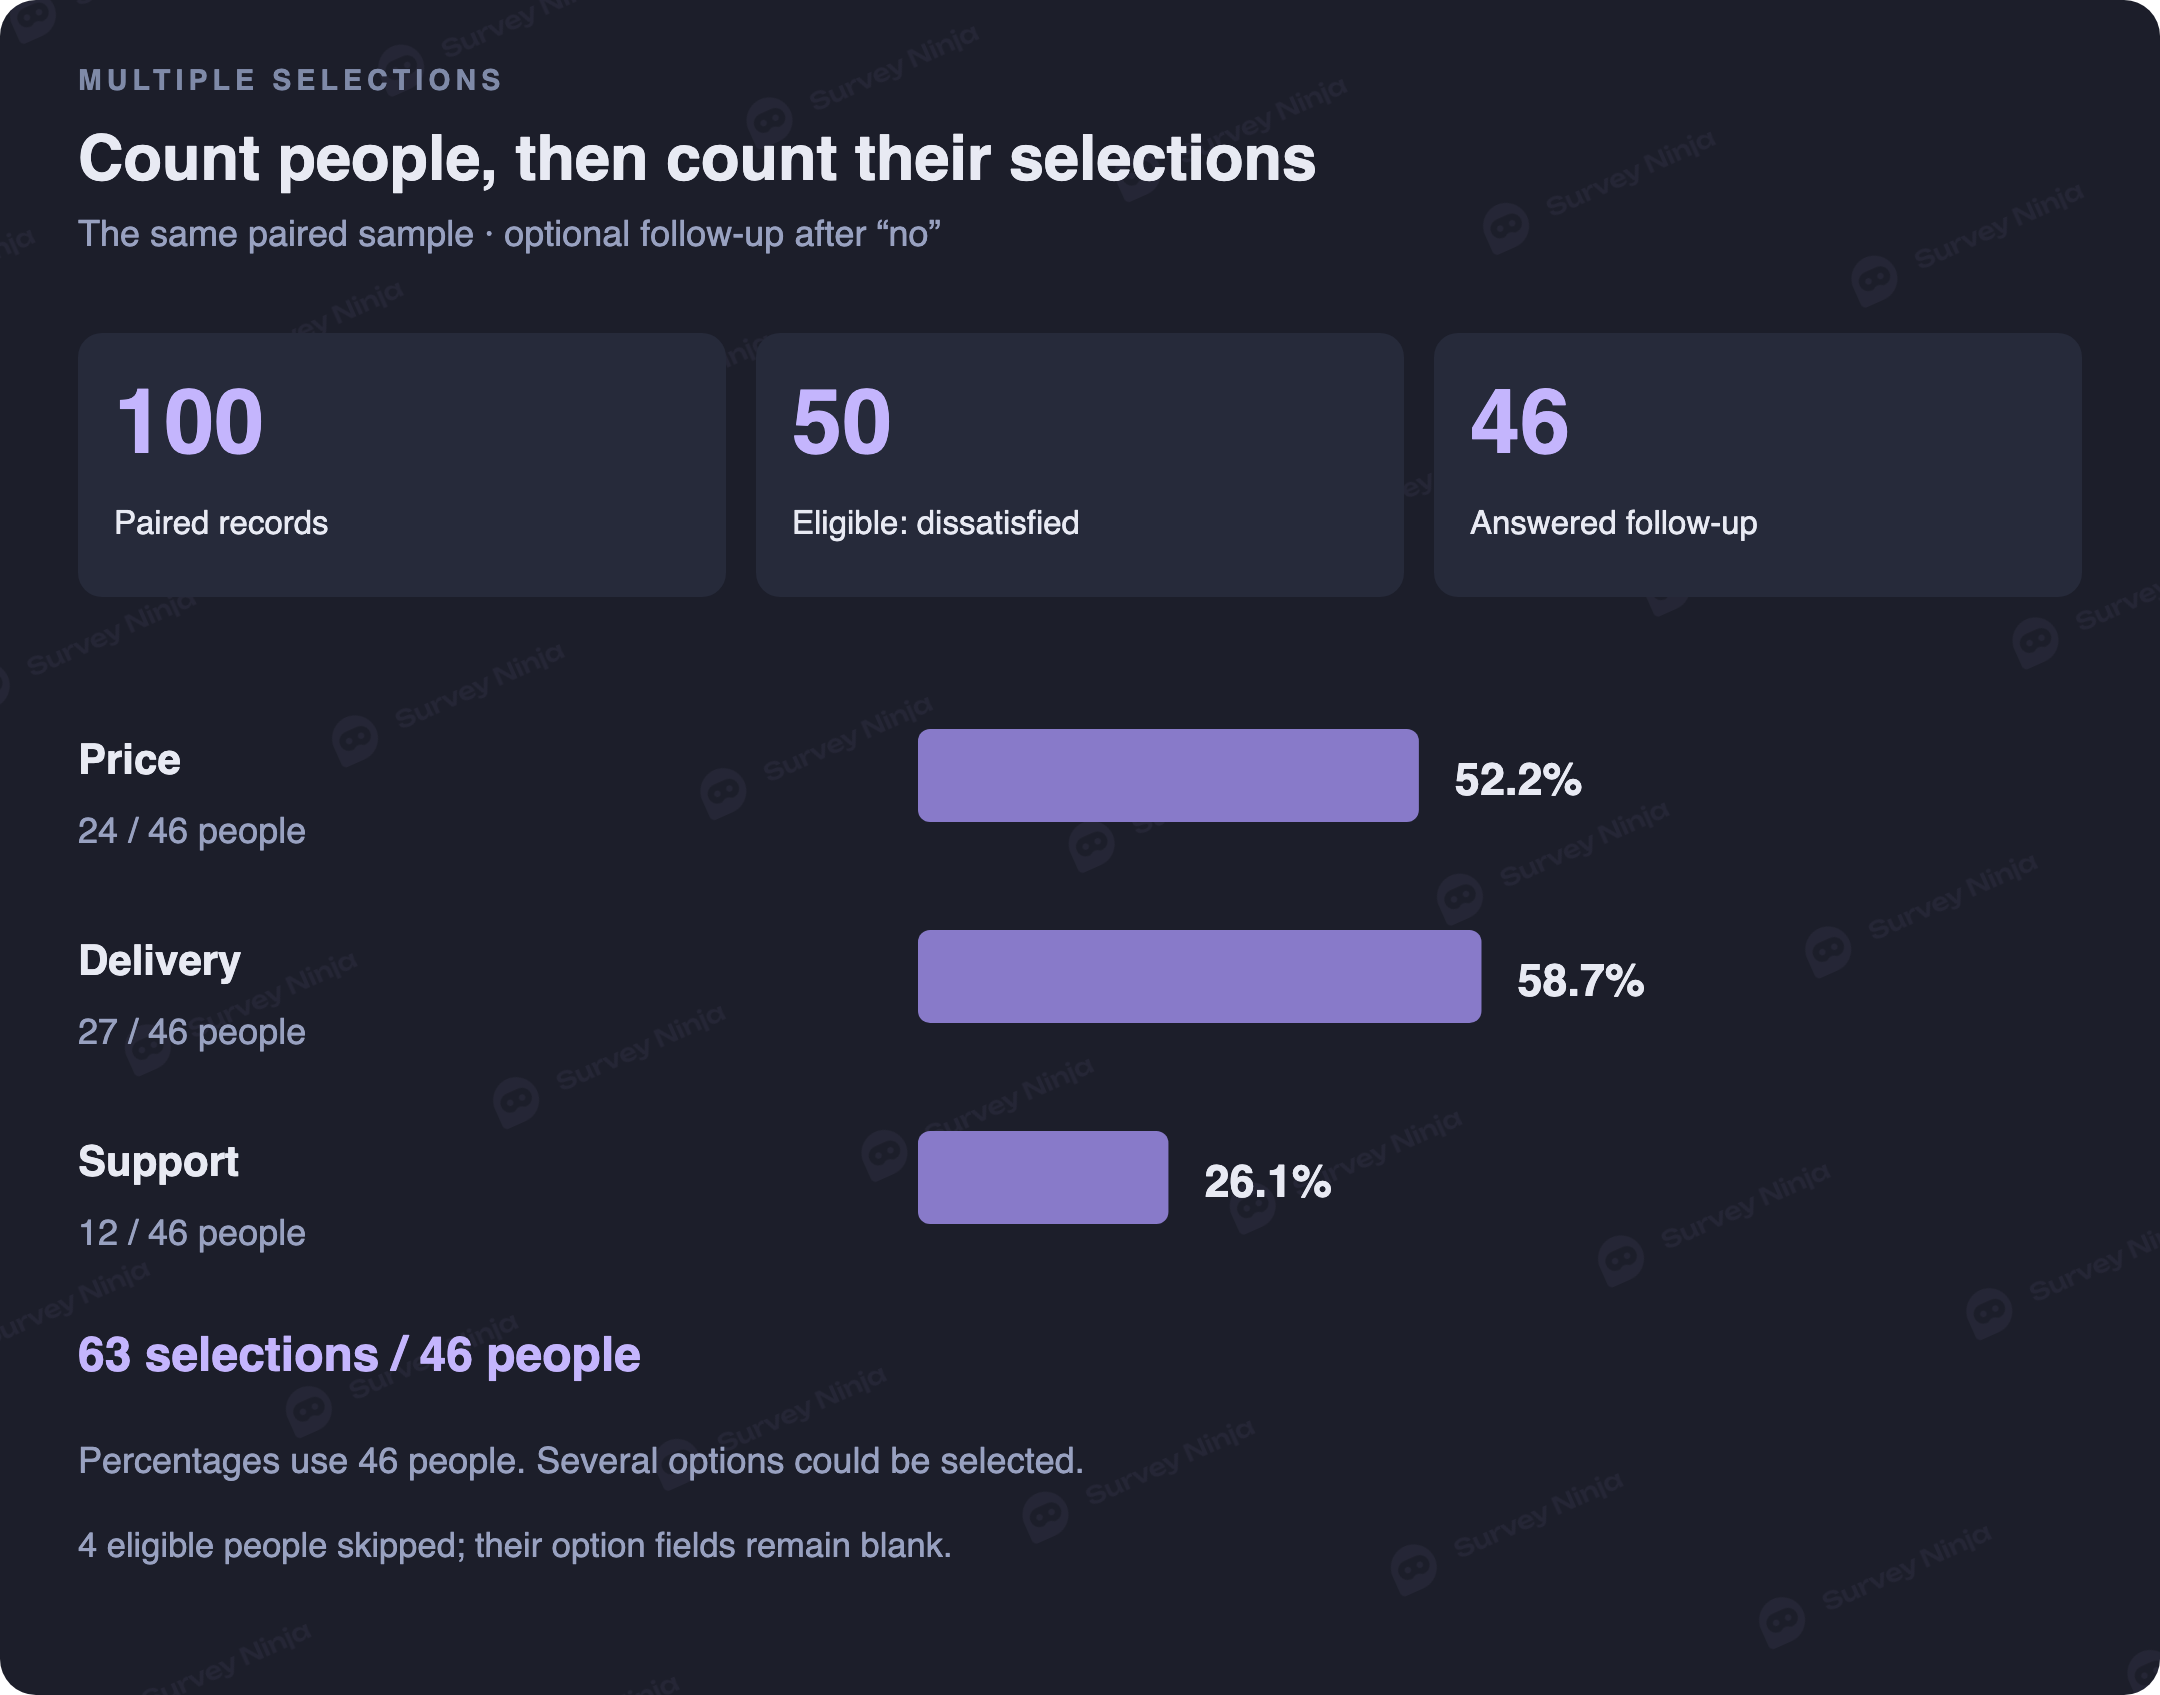
Dividing by 63 instead would describe the distribution of selections: price would be 38.1% of all selections. That can be a valid metric if explicitly labeled, but it cannot answer what percentage of people selected price. Likewise, using all 50 eligible people would give 48.0% selecting price and include the four skipped responses in the base.
For a cross-tab of reasons by customer type, use 10 valid follow-up respondents in the first-time group and 36 in the returning group. Price is 6/10 = 60.0% versus 18/36 = 50.0%. Always display those bases; using 40 and 60 would mix people who were satisfied, skipped the follow-up or never saw it into a different measure.
Take SurveyNinja responses into a spreadsheet
In SurveyNinja, open the survey’s Results area and choose Responses. Check whether you are viewing Completed or Incomplete responses, then open Filter to review the period and any answer-based restrictions. Record those settings before exporting, since changing the selected population changes every subsequent denominator.
Choose Download, select CSV or XLSX, continue to the export settings and download the file. For a simple count table, leave optional question-time and display-position columns off unless you need them. The response export guide explains where to start; keep an unedited copy and confirm the downloaded rows match your intended population.
This workflow builds the cross-tab in a spreadsheet after export. The example CSV is a teaching layout, so rename or map columns from your own export rather than expecting these exact field names. Review data export when deciding which fields belong in a shared analysis file, and remove personal identifiers that colleagues do not need.
In Excel, select the prepared records and insert a PivotTable. Add customer_type to Rows, satisfied to Columns and id to Values, summarized by Count. Add pair_valid as a filter and select 1. The resulting four counts should match the table above before you introduce any percentage calculation.
Add the count field again if you want counts and percentages together. Under Show Values As, choose % of Row Total, % of Column Total or % of Grand Total; Microsoft documents these calculations. Google Sheets also supports a pivot table workflow with Rows, Columns, Values and filters. Set the count explicitly and check the denominator.
Check the result with a formula
With the CSV headers in row 1, customer type in B, satisfaction in C and paired validity in H, this formula counts the upper-left cell. The bounded ranges include all 108 data rows:
=COUNTIFS(B2:B109,"first",C2:C109,"yes",H2:H109,1)The result is 28. If you place the four counts in B2:C3, row totals in D2:D3 and column totals in B4:C4, with the grand total in D4, use =B2/$D2 for the row percentage, =B2/B$4 for the column percentage and =B2/$D$4 for the total percentage. These references are on a separate summary sheet; they do not refer to the raw CSV cells.
Write a finding that stays within the evidence
A defensible summary is: “Among the 100 fictional respondents who answered both questions, 28 of 40 first-time customers reported satisfaction, compared with 22 of 60 returning customers. The observed difference was 33.3 percentage points. Eight records were excluded because customer type, satisfaction or both were missing.”
This is a descriptive comparison. Customer type was not randomly assigned, so the table cannot show that repeat purchasing caused lower satisfaction. Recruitment, product mix, time since purchase and missing responses could affect the pattern. Plan any follow-up around a question you can investigate, such as whether delivery issues occur more often in particular order types.
The reason comparison has a particularly small first-time base of 10: one person changes its percentage by 10 points. There is no universal cell size that makes a cross-tab reliable. Show counts, avoid presenting tiny differences as stable rankings, and use a sample-size plan suited to the precision and groups you need.
A chi-square test adds an inferential question and requires attention to independence, expected cell counts and the sampling design. Multiple selections from the same person cannot be treated as independent respondents in an ordinary contingency table. For complex samples, weights or repeated measurements, use an appropriate analysis method; keep actual respondent counts visible even when reporting weighted percentages.
For a new study, plan the comparison before collecting responses. Include the group question, decide who sees each follow-up and record the reporting base you intend to use. You can create a survey in SurveyNinja around those questions, test its routing and then use the response export workflow above. Adding a useful grouping variable after collection cannot restore an answer that was never asked.
Copy the complete example CSV
This is the same fictional dataset used in every calculation above. Save the contents as a UTF-8 CSV, import it with comma delimiters and retain blank fields. Codes are English across versions so the formulas stay reproducible: answered, skipped and not_asked describe the follow-up status. The prepared pair_valid column follows the two-question completeness rule.
id,customer_type,satisfied,reason_state,price,delivery,support,pair_valid
C001,first,yes,not_asked,,,,1
C002,first,yes,not_asked,,,,1
C003,first,yes,not_asked,,,,1
C004,first,yes,not_asked,,,,1
C005,first,yes,not_asked,,,,1
C006,first,yes,not_asked,,,,1
C007,first,yes,not_asked,,,,1
C008,first,yes,not_asked,,,,1
C009,first,yes,not_asked,,,,1
C010,first,yes,not_asked,,,,1
C011,first,yes,not_asked,,,,1
C012,first,yes,not_asked,,,,1
C013,first,yes,not_asked,,,,1
C014,first,yes,not_asked,,,,1
C015,first,yes,not_asked,,,,1
C016,first,yes,not_asked,,,,1
C017,first,yes,not_asked,,,,1
C018,first,yes,not_asked,,,,1
C019,first,yes,not_asked,,,,1
C020,first,yes,not_asked,,,,1
C021,first,yes,not_asked,,,,1
C022,first,yes,not_asked,,,,1
C023,first,yes,not_asked,,,,1
C024,first,yes,not_asked,,,,1
C025,first,yes,not_asked,,,,1
C026,first,yes,not_asked,,,,1
C027,first,yes,not_asked,,,,1
C028,first,yes,not_asked,,,,1
C029,first,no,answered,1,0,1,1
C030,first,no,answered,1,0,1,1
C031,first,no,answered,1,0,1,1
C032,first,no,answered,1,0,0,1
C033,first,no,answered,1,0,0,1
C034,first,no,answered,1,1,0,1
C035,first,no,answered,0,1,0,1
C036,first,no,answered,0,1,0,1
C037,first,no,answered,0,1,0,1
C038,first,no,answered,0,1,0,1
C039,first,no,skipped,,,,1
C040,first,no,skipped,,,,1
C041,returning,yes,not_asked,,,,1
C042,returning,yes,not_asked,,,,1
C043,returning,yes,not_asked,,,,1
C044,returning,yes,not_asked,,,,1
C045,returning,yes,not_asked,,,,1
C046,returning,yes,not_asked,,,,1
C047,returning,yes,not_asked,,,,1
C048,returning,yes,not_asked,,,,1
C049,returning,yes,not_asked,,,,1
C050,returning,yes,not_asked,,,,1
C051,returning,yes,not_asked,,,,1
C052,returning,yes,not_asked,,,,1
C053,returning,yes,not_asked,,,,1
C054,returning,yes,not_asked,,,,1
C055,returning,yes,not_asked,,,,1
C056,returning,yes,not_asked,,,,1
C057,returning,yes,not_asked,,,,1
C058,returning,yes,not_asked,,,,1
C059,returning,yes,not_asked,,,,1
C060,returning,yes,not_asked,,,,1
C061,returning,yes,not_asked,,,,1
C062,returning,yes,not_asked,,,,1
C063,returning,no,answered,1,0,1,1
C064,returning,no,answered,1,0,1,1
C065,returning,no,answered,1,0,1,1
C066,returning,no,answered,1,0,1,1
C067,returning,no,answered,1,0,1,1
C068,returning,no,answered,1,0,1,1
C069,returning,no,answered,1,0,1,1
C070,returning,no,answered,1,0,1,1
C071,returning,no,answered,1,0,1,1
C072,returning,no,answered,1,0,0,1
C073,returning,no,answered,1,0,0,1
C074,returning,no,answered,1,0,0,1
C075,returning,no,answered,1,0,0,1
C076,returning,no,answered,1,0,0,1
C077,returning,no,answered,1,1,0,1
C078,returning,no,answered,1,1,0,1
C079,returning,no,answered,1,1,0,1
C080,returning,no,answered,1,1,0,1
C081,returning,no,answered,0,1,0,1
C082,returning,no,answered,0,1,0,1
C083,returning,no,answered,0,1,0,1
C084,returning,no,answered,0,1,0,1
C085,returning,no,answered,0,1,0,1
C086,returning,no,answered,0,1,0,1
C087,returning,no,answered,0,1,0,1
C088,returning,no,answered,0,1,0,1
C089,returning,no,answered,0,1,0,1
C090,returning,no,answered,0,1,0,1
C091,returning,no,answered,0,1,0,1
C092,returning,no,answered,0,1,0,1
C093,returning,no,answered,0,1,0,1
C094,returning,no,answered,0,1,0,1
C095,returning,no,answered,0,1,0,1
C096,returning,no,answered,0,1,0,1
C097,returning,no,answered,0,1,0,1
C098,returning,no,answered,0,1,0,1
C099,returning,no,skipped,,,,1
C100,returning,no,skipped,,,,1
C101,,yes,not_asked,,,,0
C102,,yes,not_asked,,,,0
C103,,no,answered,1,0,0,0
C104,,no,answered,0,1,0,0
C105,first,,not_asked,,,,0
C106,first,,not_asked,,,,0
C107,returning,,not_asked,,,,0
C108,,,not_asked,,,,0
Frequently asked questions
What is cross-tabulation in a survey?
It is a table of counts for combinations of two categorical variables, such as customer type and satisfaction. Percentages can describe outcomes within groups, the composition of an outcome or the distribution of the whole analyzed sample, depending on the denominator.
Should I use row or column percentages?
Use row percentages to compare outcomes within groups when groups occupy the rows. Use column percentages to describe who makes up an outcome when outcomes occupy the columns. If you swap the table orientation, the direction changes; choose the denominator from the question you need to answer.
Why can the same cell be 70%, 56% and 28%?
In this example the cell contains 28 people. Dividing by its row total of 40 gives 70%, by its column total of 50 gives 56%, and by the paired sample of 100 gives 28%. Each calculation describes a different population.
How do I handle missing answers?
Document which records are eligible for each table and count excluded people without duplication. The main example uses 100 of 108 records with both required answers. Four lack customer type only, three lack satisfaction only and one lacks both.
Why can multiple-answer percentages exceed 100%?
One respondent can select several options. In the follow-up example, 46 people make 63 selections, so option percentages calculated from people sum to 137.0% after rounding. Percentages based on selections answer a different question and need a separate label.
Can I make the table in Excel or Google Sheets?
Yes. Put the group in Rows, the outcome in Columns and the unique response ID in Values, summarized by Count. Apply the intended eligibility filter, reconcile the counts and then choose the percentage denominator. Keep actual counts alongside the percentages.
Do cross-tabs prove that groups differ?
A table shows an observed pattern in the analyzed responses. A population claim needs an appropriate sampling and inferential method, and an association does not by itself demonstrate causation. Small groups, missing answers and repeated responses can materially affect the interpretation.
Can I use weighted survey responses?
Weighted percentages require sums of respondent weights in both numerator and denominator for the same eligible records. Report actual respondent counts separately and document the weighting method. The tutorial CSV is unweighted, so its calculations use people rather than sums of weights.
Published: Oct 11, 2026