


 25 Questions for a Construction Customer Satisfaction Survey
How to Run an NPS Survey
Updated
On this page
At the end of this guide you'll have a published NPS survey: the "How likely are you to recommend us?" question, a follow-up question that asks each group of customers why, and a report that calculates your Net Promoter Score. It takes 9 steps and about 15 minutes. As an example, we build a survey for customers of the Brew & Bean coffee shop.
Before you start
You need a SurveyNinja account. The basic NPS survey works on every plan. Some steps use features from paid plans:
| What you use | Plan |
|---|---|
| NPS question, follow-up question with the score in its text, link, website embed, micro survey, report | All plans |
| Different follow-up questions for each group, Thank You Screen, report filters, downloading responses | Basic and higher |
| Hidden variables, unique links | Standard and higher |
Step 1. Create the survey
- On the dashboard, click Create new survey.
- Choose Start from scratch.
- Enter a name, for example "Brew & Bean NPS", and click Create survey. The builder opens.
You can also choose With the help of AI and describe the survey: "Create an NPS survey for customers of the Brew & Bean coffee shop. Ask how likely they are to recommend us on a scale from 0 to 10, then ask one open question about the reason for the score." Check the draft against steps 2–4. See Creating a Survey with AI.
Step 2. Add the NPS question
- In Builder, click +.
- In the Scales and ratings section, click NPS.
- Type the question: "How likely are you to recommend Brew & Bean to a friend?".
- Click the labels under the scale and change them: "Not at all likely" under 0, "OK" under 5 and "Extremely likely" under 10.
- Click Settings (the gear) on the question and turn off Center label, so that the number 5 has no label for respondents.
- In the same panel, turn on Required response. The follow-up in step 3 depends on the score.
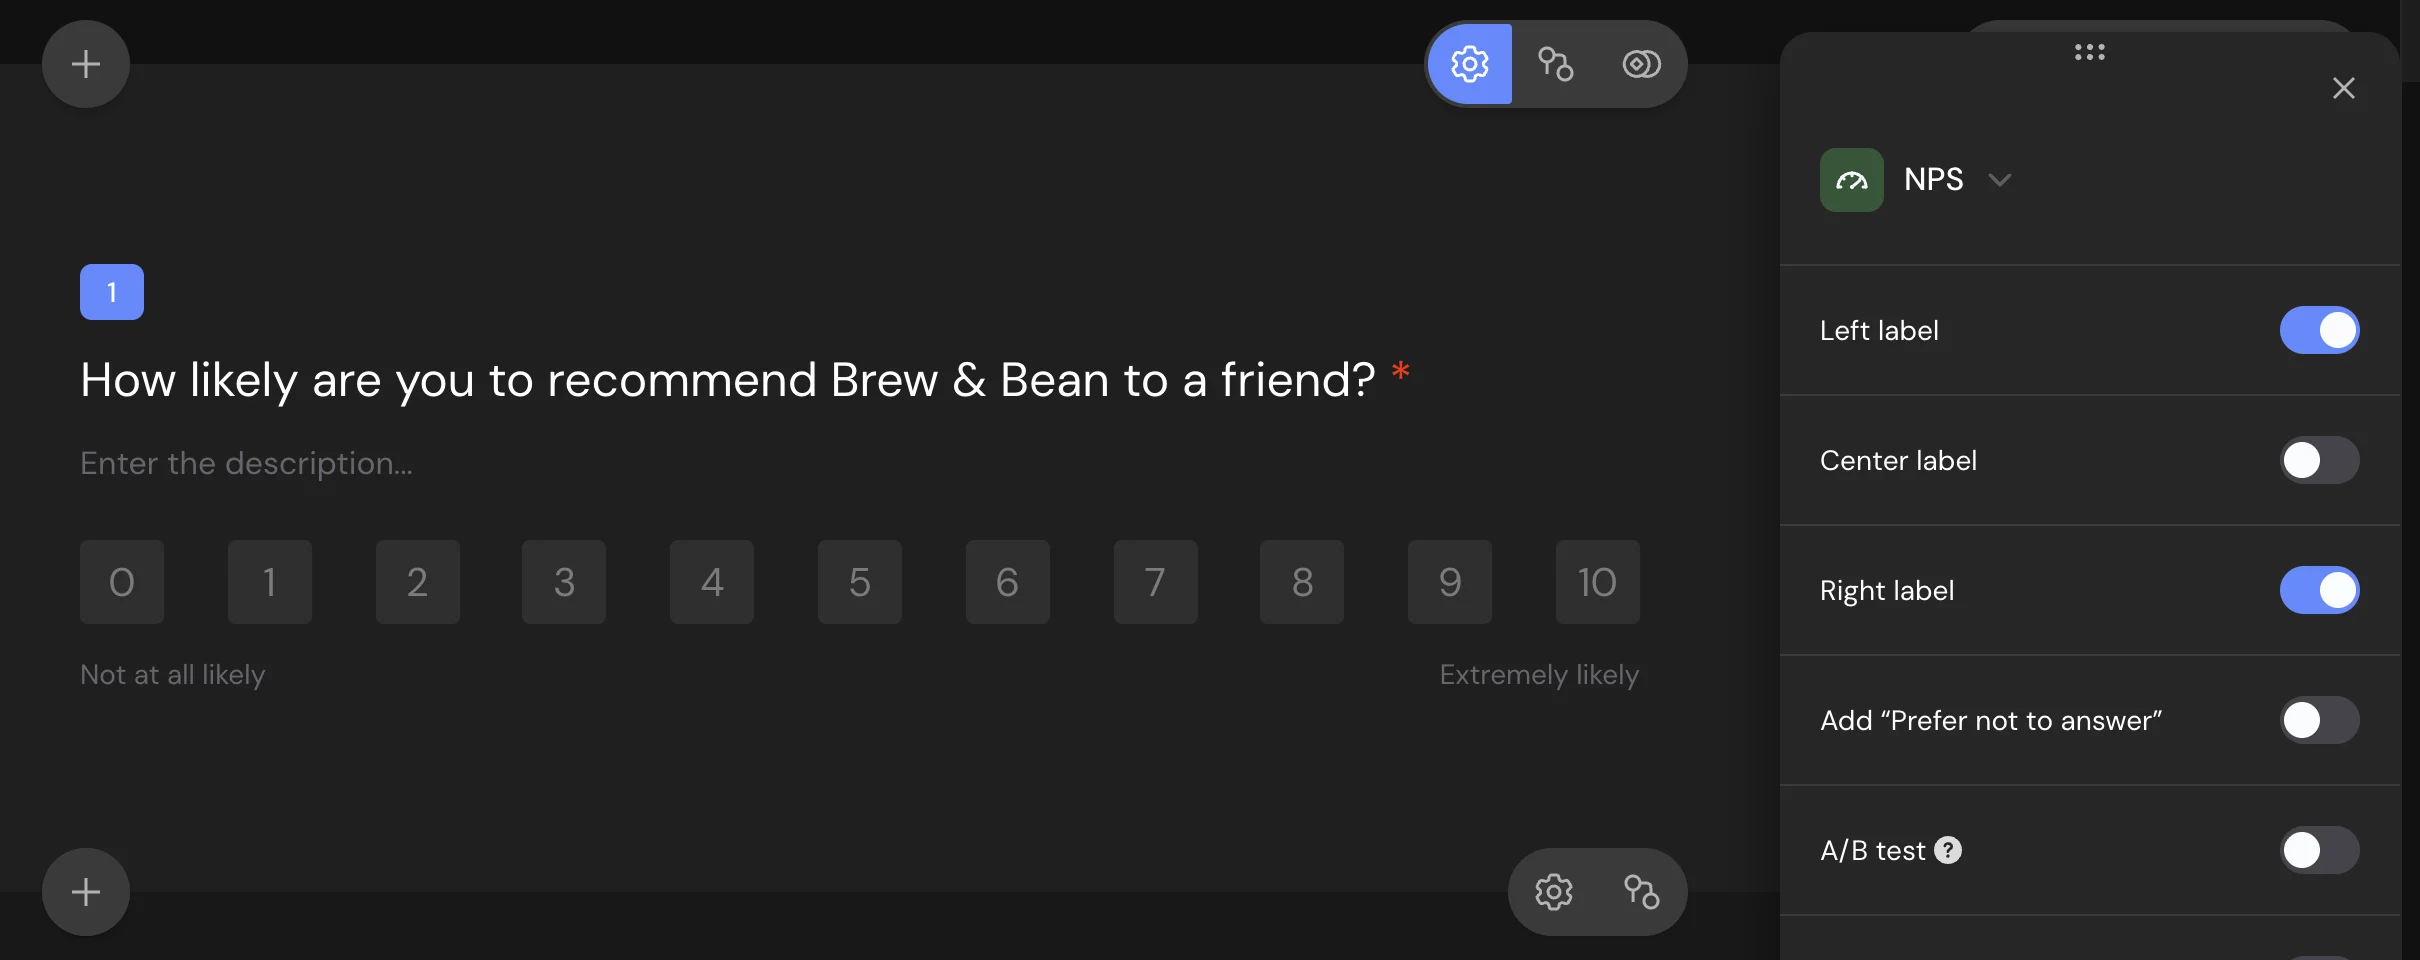
The label texts name the three groups in the report: 0–6, 7–8 and 9–10. More about the question: Net Promoter Score (NPS) Question.
Step 3. Ask why after the score
The score shows how many customers are loyal, the follow-up answer shows what to fix. Choose one of two ways.
One question for everyone (all plans)
- Click + under the NPS question and choose Enter Text in the Open-ended section.
- In the question title, type "You rated us ", then type @ and pick the NPS question from the list.
- Finish the title: "out of 10. What's the main reason for your score?".
Respondents see their own score in the text, for example "You rated us 6 out of 10". See Reusing Answers in Survey Questions.
A different question for each group (Basic and higher)
- Add 3 Enter Text questions under the NPS question:
– "Sorry to hear that. What disappointed you at Brew & Bean?" for detractors (0–6);
– "What would make Brew & Bean a 10 for you?" for passives (7–8);
– "Glad you like us. What do you enjoy most at Brew & Bean?" for promoters (9–10). - Hover over the first of them and click the Logic Jumps icon on its toolbar.
- Click Add display condition.
- In IF, choose the NPS question, Less than or equal to and 6. In THEN, choose Show. The current question is already selected. Click Save.
- Repeat for the second question: More than or equal to 7, then click Add a condition, choose AND and add Less than or equal to 8.
- Repeat for the third question: More than or equal to 9.

Each respondent sees only the question for their group. See Logic Jumps.
Step 4. Add a Thank You Screen
Click + at the end of the survey and choose Thank You Screen in the Basic section. Type the text, for example "Thank you! See you at Brew & Bean." The Thank You Screen is available on the Basic plan and higher. On the Free plan, respondents see the SurveyNinja thank-you page.
Tip. You can add a second Thank You Screen for promoters, for example with a button that leads to your review page, and send promoters there with a logic jump and the Finish survey early action. See Welcome, Thank You and Other Survey Screens.
Step 5. Check the survey and publish it
- Click Preview in the top bar and answer the survey 3 times: with 3, 8 and 10. Click Reset responses to start again. After each score you should see the follow-up question for that group.
- Click Publish. The Share the Survey panel opens with the survey link.

Responses given in Preview don't get into the report. See Previewing Your Survey and Publishing a Survey.
Step 6. Pass the customer ID and segment (optional)
Paid feature. Hidden variables are available on the Standard plan and higher. Compare plans
If you send the survey to known customers, add their data to the link, and it arrives with each response:
- Go to Share → URL parameters.
- In Variables in the link, click client_id.
- Under Custom variable, type "segment" and click Add.
- Click Copy link and replace each xxxx with a real value, for example ?client_id=1042&segment=regular.
See Hidden Variables.
Step 7. Share the survey
Pick the channel where your customers are:
- Link. Copy the link in Share → Link and post it in a chat, a receipt QR code or a newsletter. In an email service, put the recipient's ID into the link with a merge tag, as described in Hidden Variables.
- Unique links (Standard and higher). Create one single-use link per customer, download them in Excel and send them from your email service. Every response shows which link it came from. See Unique Survey Links.
- Website. Go to Share → On website, choose Pop-up window and turn on Don't show after submission. See Publishing a Survey and Adding It to a Website.
- Micro survey. A short card in a corner of your website. A micro survey is a separate survey type: create one with Create new survey → Micro survey and add the same NPS question. See Micro Surveys on Your Website.
Step 8. Read the NPS in the report
Open Results → Reports. The NPS card splits the answers into 3 groups: 9–10 (promoters), 7–8 (passives) and 0–6 (detractors), and shows the number and the share of each group.
NPS = the percentage of promoters minus the percentage of detractors, rounded to a whole number, from −100 to 100. For example, Brew & Bean got 120 responses: 54 scores of 9–10 (45%), 42 of 7–8 (35%) and 24 of 0–6 (20%). NPS = 45 − 20 = 25.
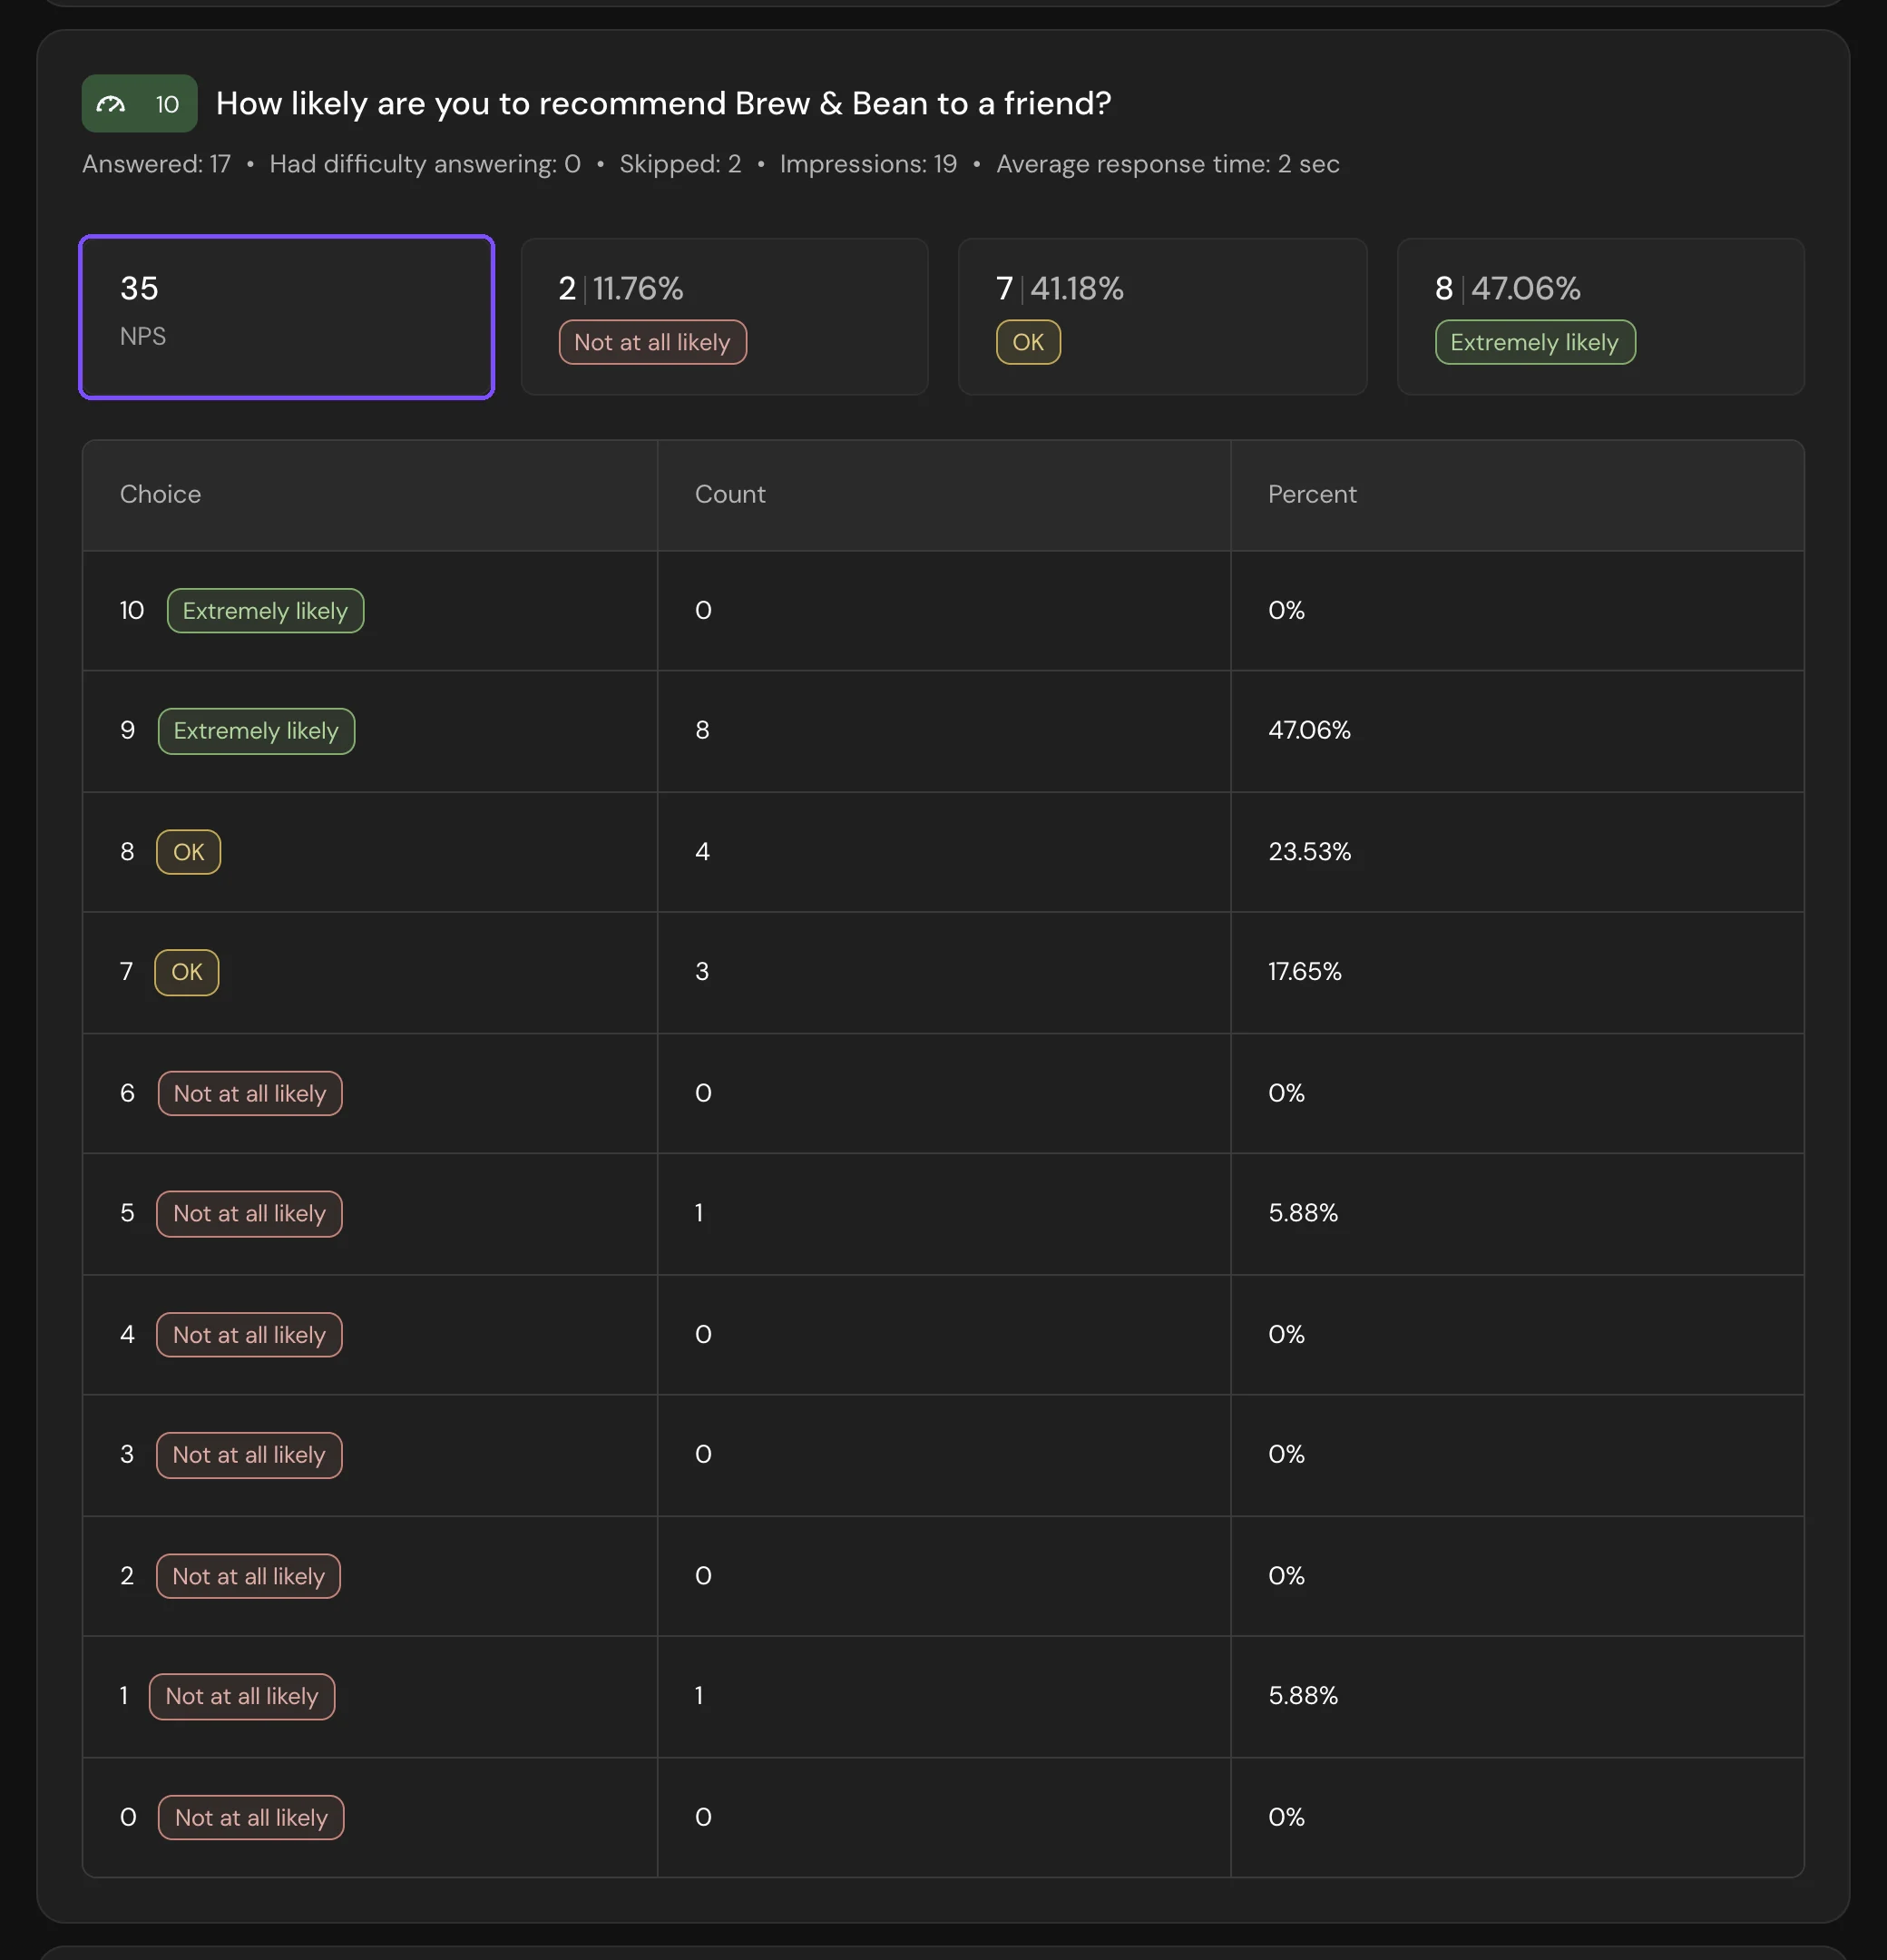
To read only what detractors wrote, click Filter, open Filter by answers, choose the NPS question, Less than or equal to and 6, then click Apply (Basic and higher). With hidden variables, the Hidden Variables filter compares segments. See Viewing the Survey Report.
Step 9. Download the responses
- Go to Results → Responses.
- Click the Download icon and choose XLSX or CSV.
- Click Continue, then Download.
The NPS answer is a column with the number from 0 to 10, and each hidden variable is a separate column. Downloading is available on the Basic plan and higher. See Viewing and Downloading Survey Responses.
What's next
- To run the same NPS survey every quarter, save it as a template: Custom Templates.
- To get an email for each new response, turn on notifications.
- To stop collecting responses after the campaign, close the survey.
- To send each response to a spreadsheet, connect Google Sheets.