


Semantic Differential Questions
Updated
On this page
A semantic differential question shows pairs of opposite words, such as "Cheap — Expensive" or "Modern — Old-fashioned", with a 5-point scale between them. The respondent picks the point closest to their impression. Researchers use it to measure how people see a brand, product or service, for example "How would you describe Brew & Bean?" with rows Cold — Cozy, Slow — Fast and Ordinary — Unique. Unlike a Likert scale, there's no statement to agree with: each row is its own pair of opposites.
Paid feature. Semantic differential is available on the Basic plan and higher. Compare plans
Adding a semantic differential question
- In Builder, click + above or below a question.
- In the Scales and ratings section, click Semantic differential.
- In each row, type the left word and the right word. Add rows with Add, and drag them by the handle to change the order.
A new question has 2 rows. More on adding questions: Question Types.
Settings
| Setting | What it does |
|---|---|
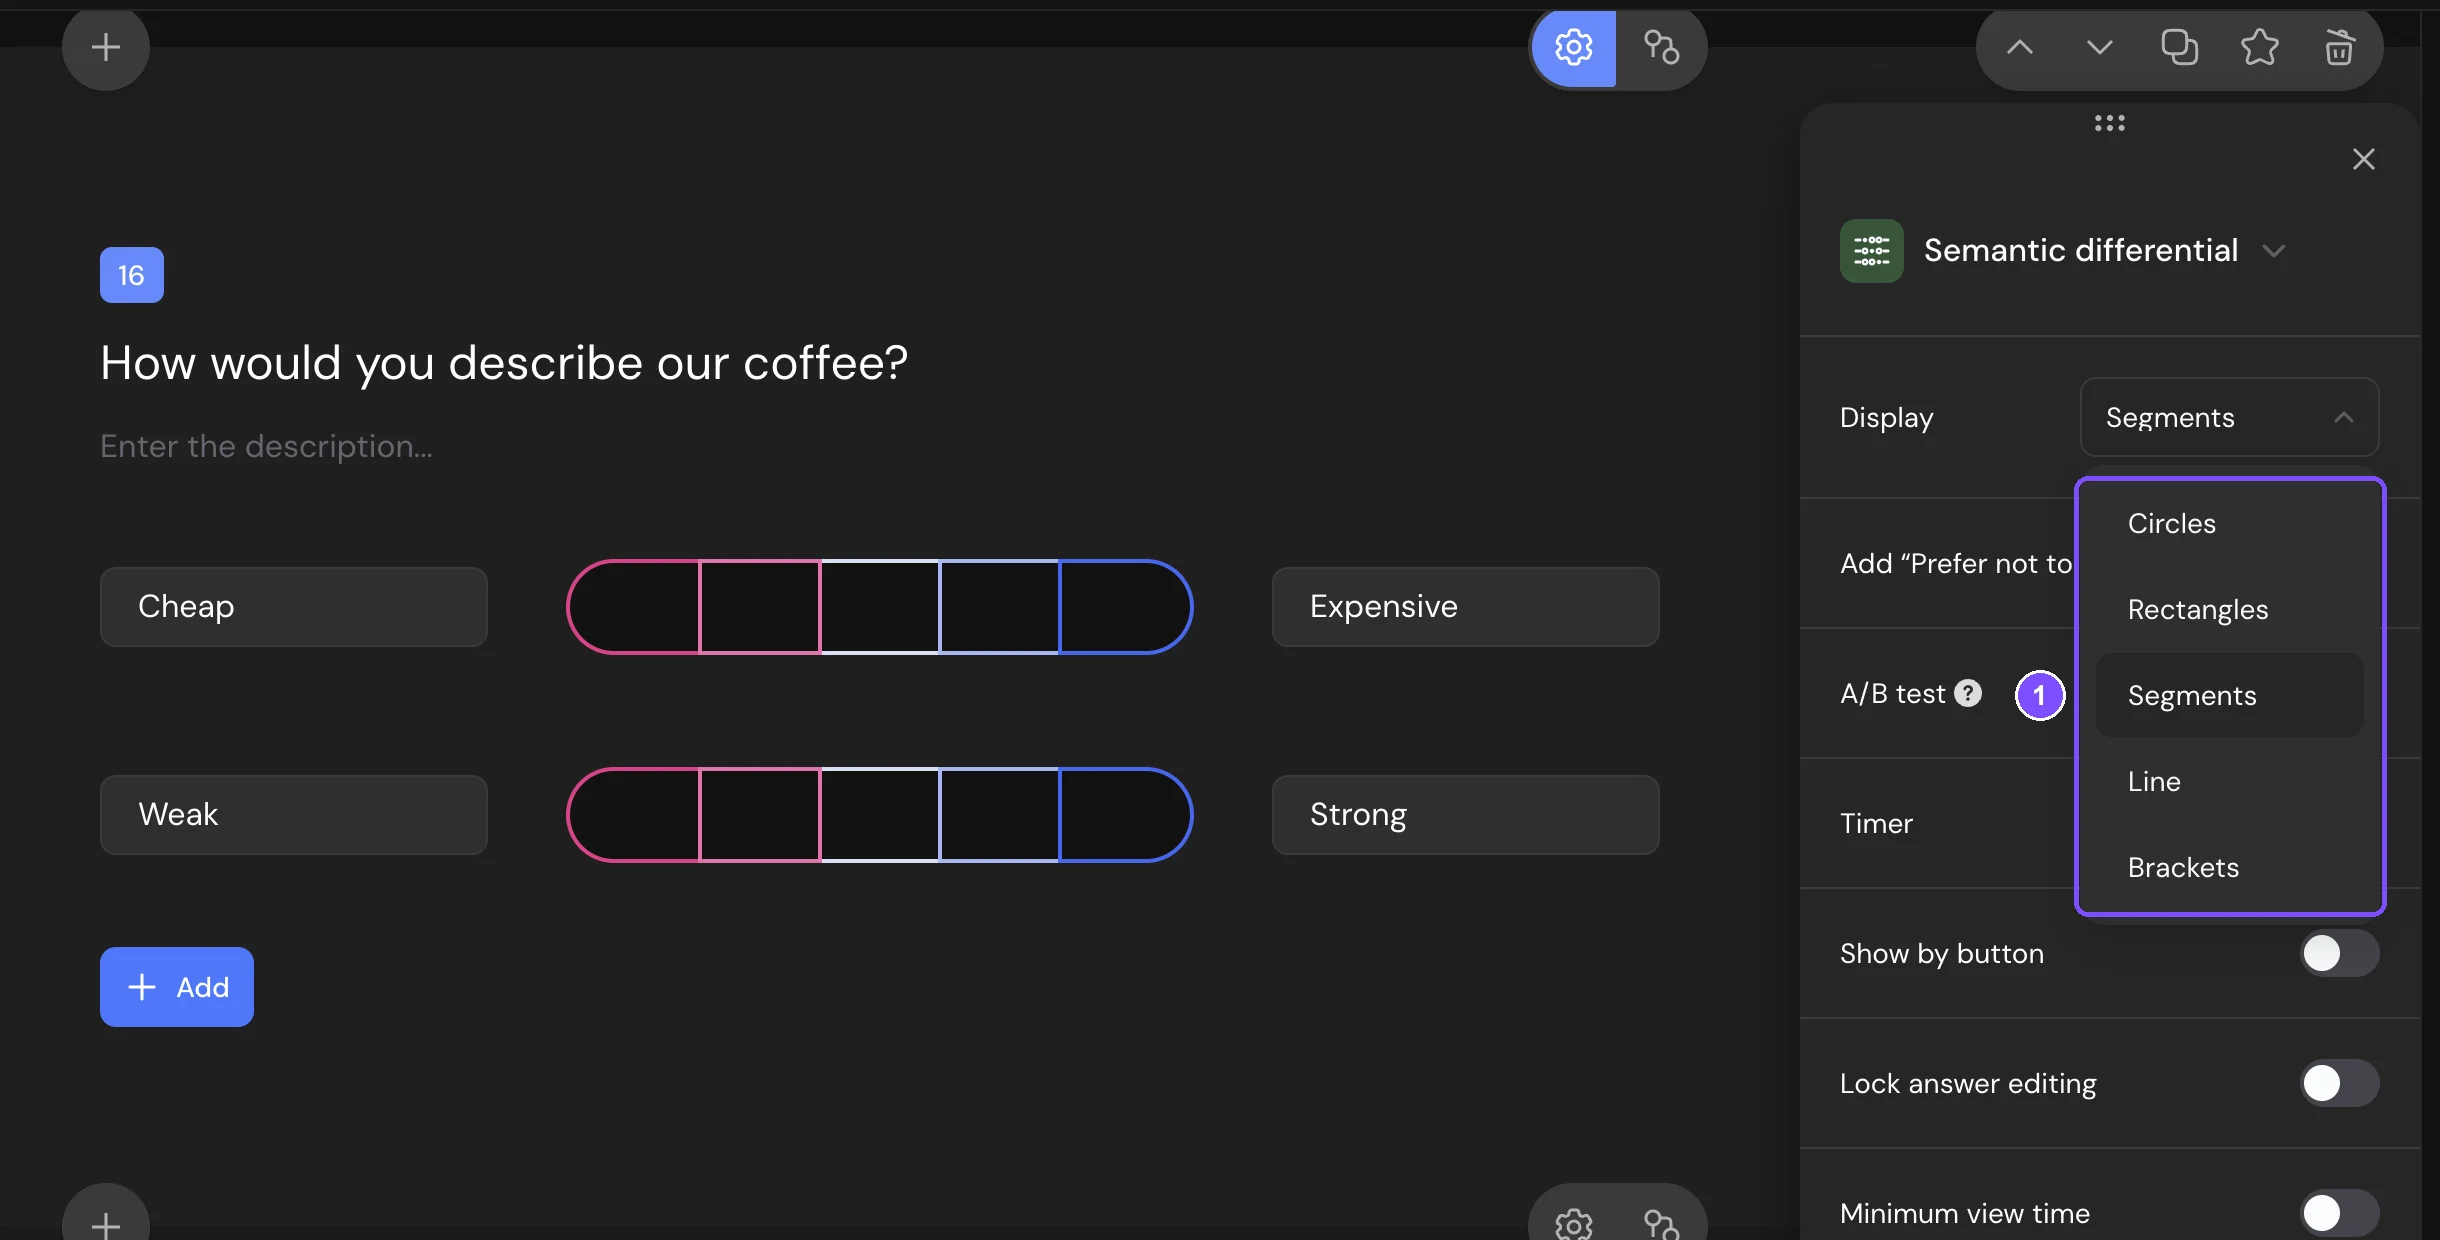
| Display | How the 5 points look: Circles, Rectangles, Segments (the default), Line or Brackets. |
The scale always has 5 points. Common settings such as Add “Prefer not to answer”, Timer and Required response are described in Question Settings.
What respondents see
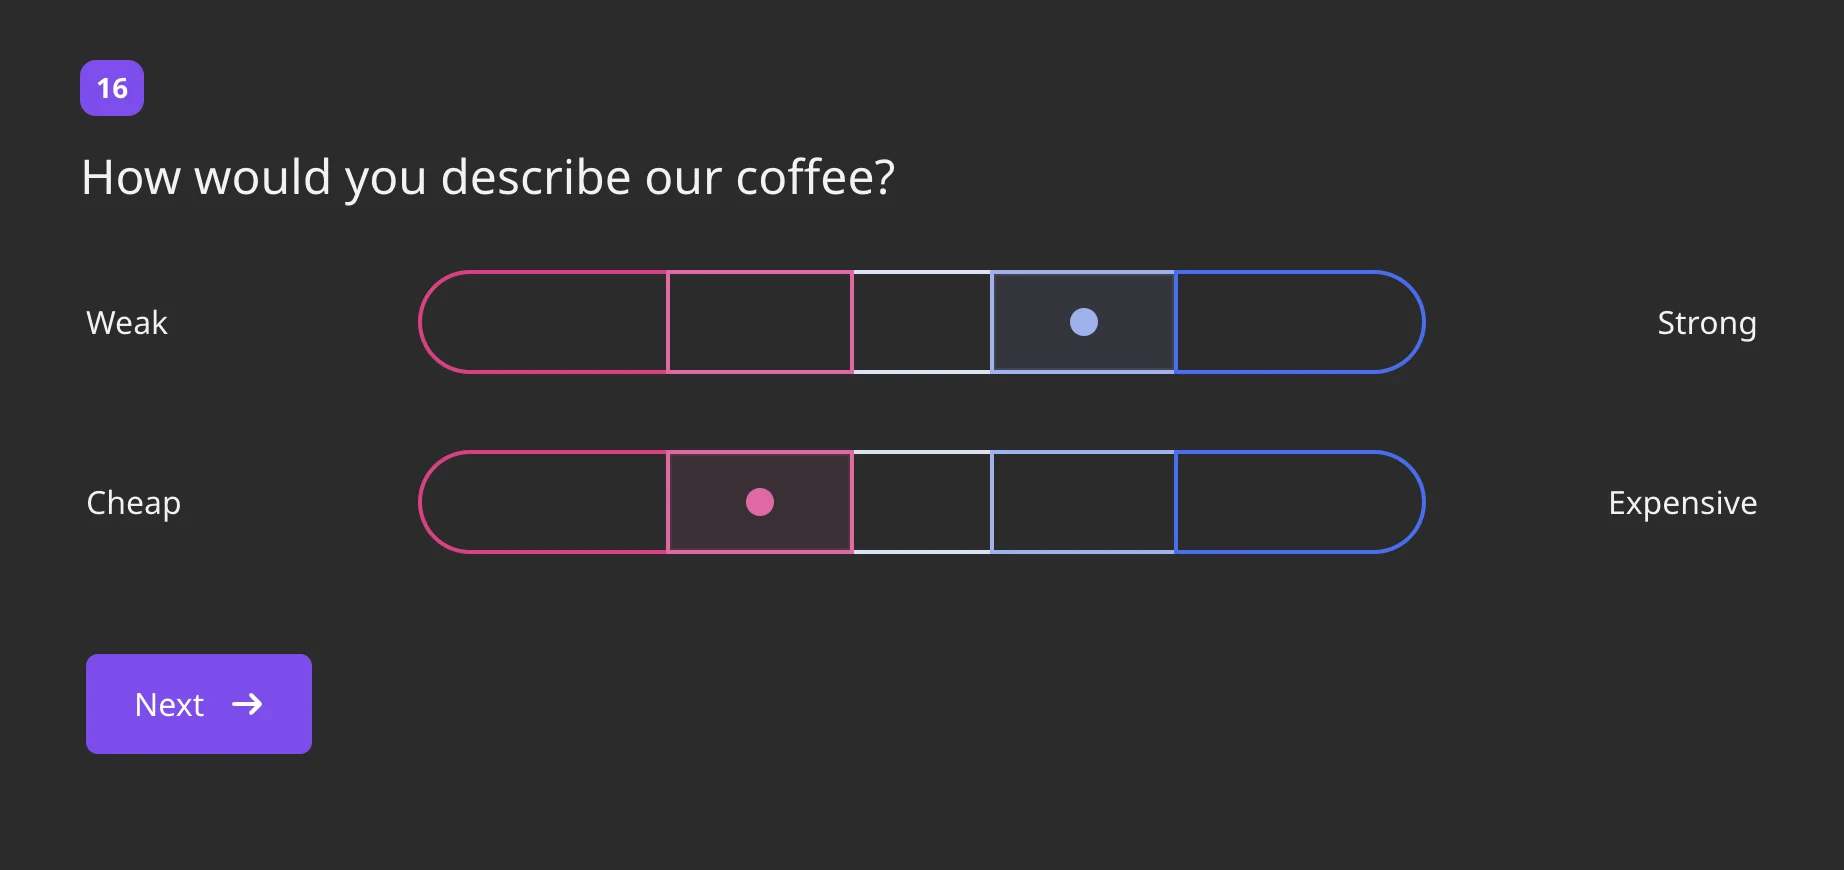
Each row shows the left word, the 5 points and the right word. The respondent clicks a point. Clicking it again clears the choice. On a phone or a narrow screen, both words move above the scale, the left one on the left and the right one on the right.
Once the respondent answers any row, they must answer every row to continue. A question that isn't required can only be skipped as a whole.
Responses and report
Points are counted from 1 (next to the left word) to 5 (next to the right word). In Results → Reports, the question has three views:
- Table: every row with the number of respondents who chose each point. Cells with more answers get more color. Above the report, switch between Numbers and percentages, Numbers and Percentages.
- Average rating: a profile chart. The left words are on the left axis, the right words on the right axis, and a line connects the average score of each row, so the whole profile of the brand fits in one chart.
- Bars: one chart per row with the answers for each point and "Average:" in the corner.
In a CSV or XLSX file, the question takes one column: "Cold / Cozy: 4, Slow / Fast: 2". See Viewing and Downloading Survey Responses.
To filter responses, add the question in the report filter and compare the score of a row with a number (Basic plan and higher).
Logic and scores
In logic jumps, pick a row, then compare its score: Equals, Does not equal, Less than, More than and others, or Is answered. For example, send respondents who chose 1 or 2 on "Slow — Fast" to a question about wait times. Semantic differential questions don't have scores.
Limits
- The scale has 5 points. It can't be changed.
- A question needs at least 1 row.
- Semantic differential can't be used in micro surveys.