


Allocation Slider (Constant Sum Question)
Updated
On this page
An allocation slider gives respondents a fixed budget, for example 100 points, and asks them to split it among options. Researchers call this a constant sum question. Use it when you need to know not only which option matters most, but by how much: "Distribute 100 points among what matters to you in a coffee shop: Taste, Price, Speed, Atmosphere". A respondent who gives 60 points to Taste and 10 to Price tells you more than a ranking would.
Paid feature. Allocation slider is available on the Basic plan and higher. Compare plans
Adding an allocation slider
- In Builder, click + above or below a question.
- In the Scales and ratings section, click Allocation slider.
- Type the options. Add more with Add, or paste a list with Add to list.
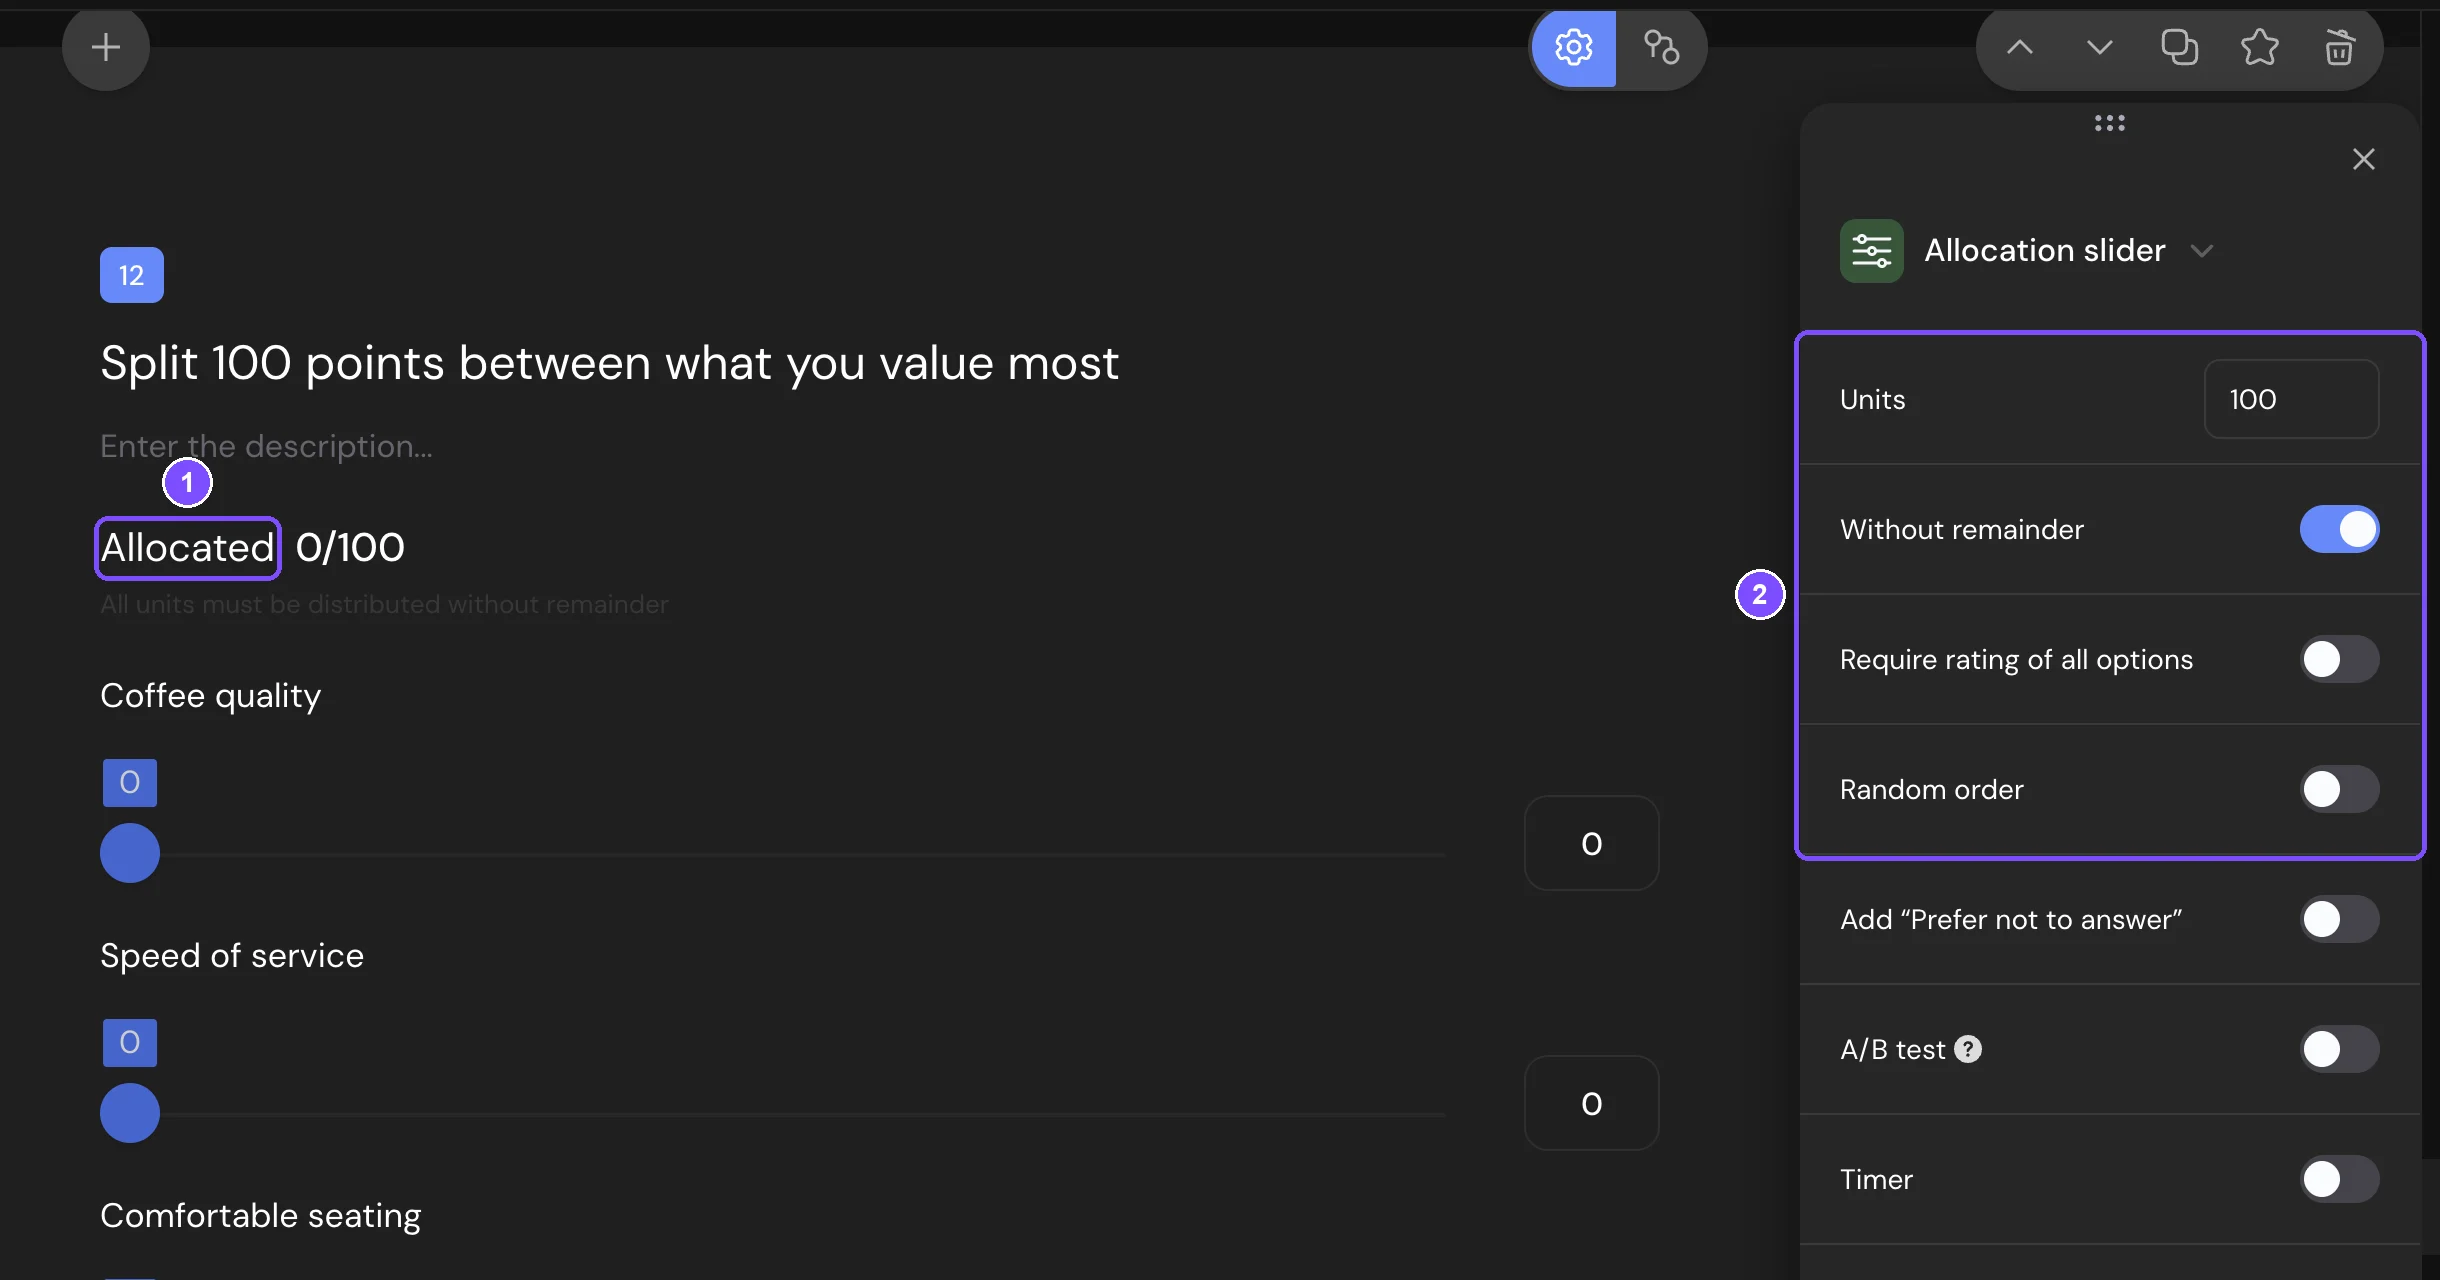
- To rename the counter above the sliders (Allocated by default), click its label and type, for example "Points used".
A new question has 3 options. More on adding questions: Question Types.
Settings
| Setting | What it does |
|---|---|
| Units | The total number of points to distribute, from 1 to 10,000. The default is 100. |
| Without remainder | The respondent must use all the points to answer. |
| Require rating of all options | Every option must get at least 1 point. With this setting on, Units can't be less than the number of options. |
| Random order | Shows the options in a different order to each respondent. |
Common settings such as Timer and Required response are described in Question Settings.
What respondents see
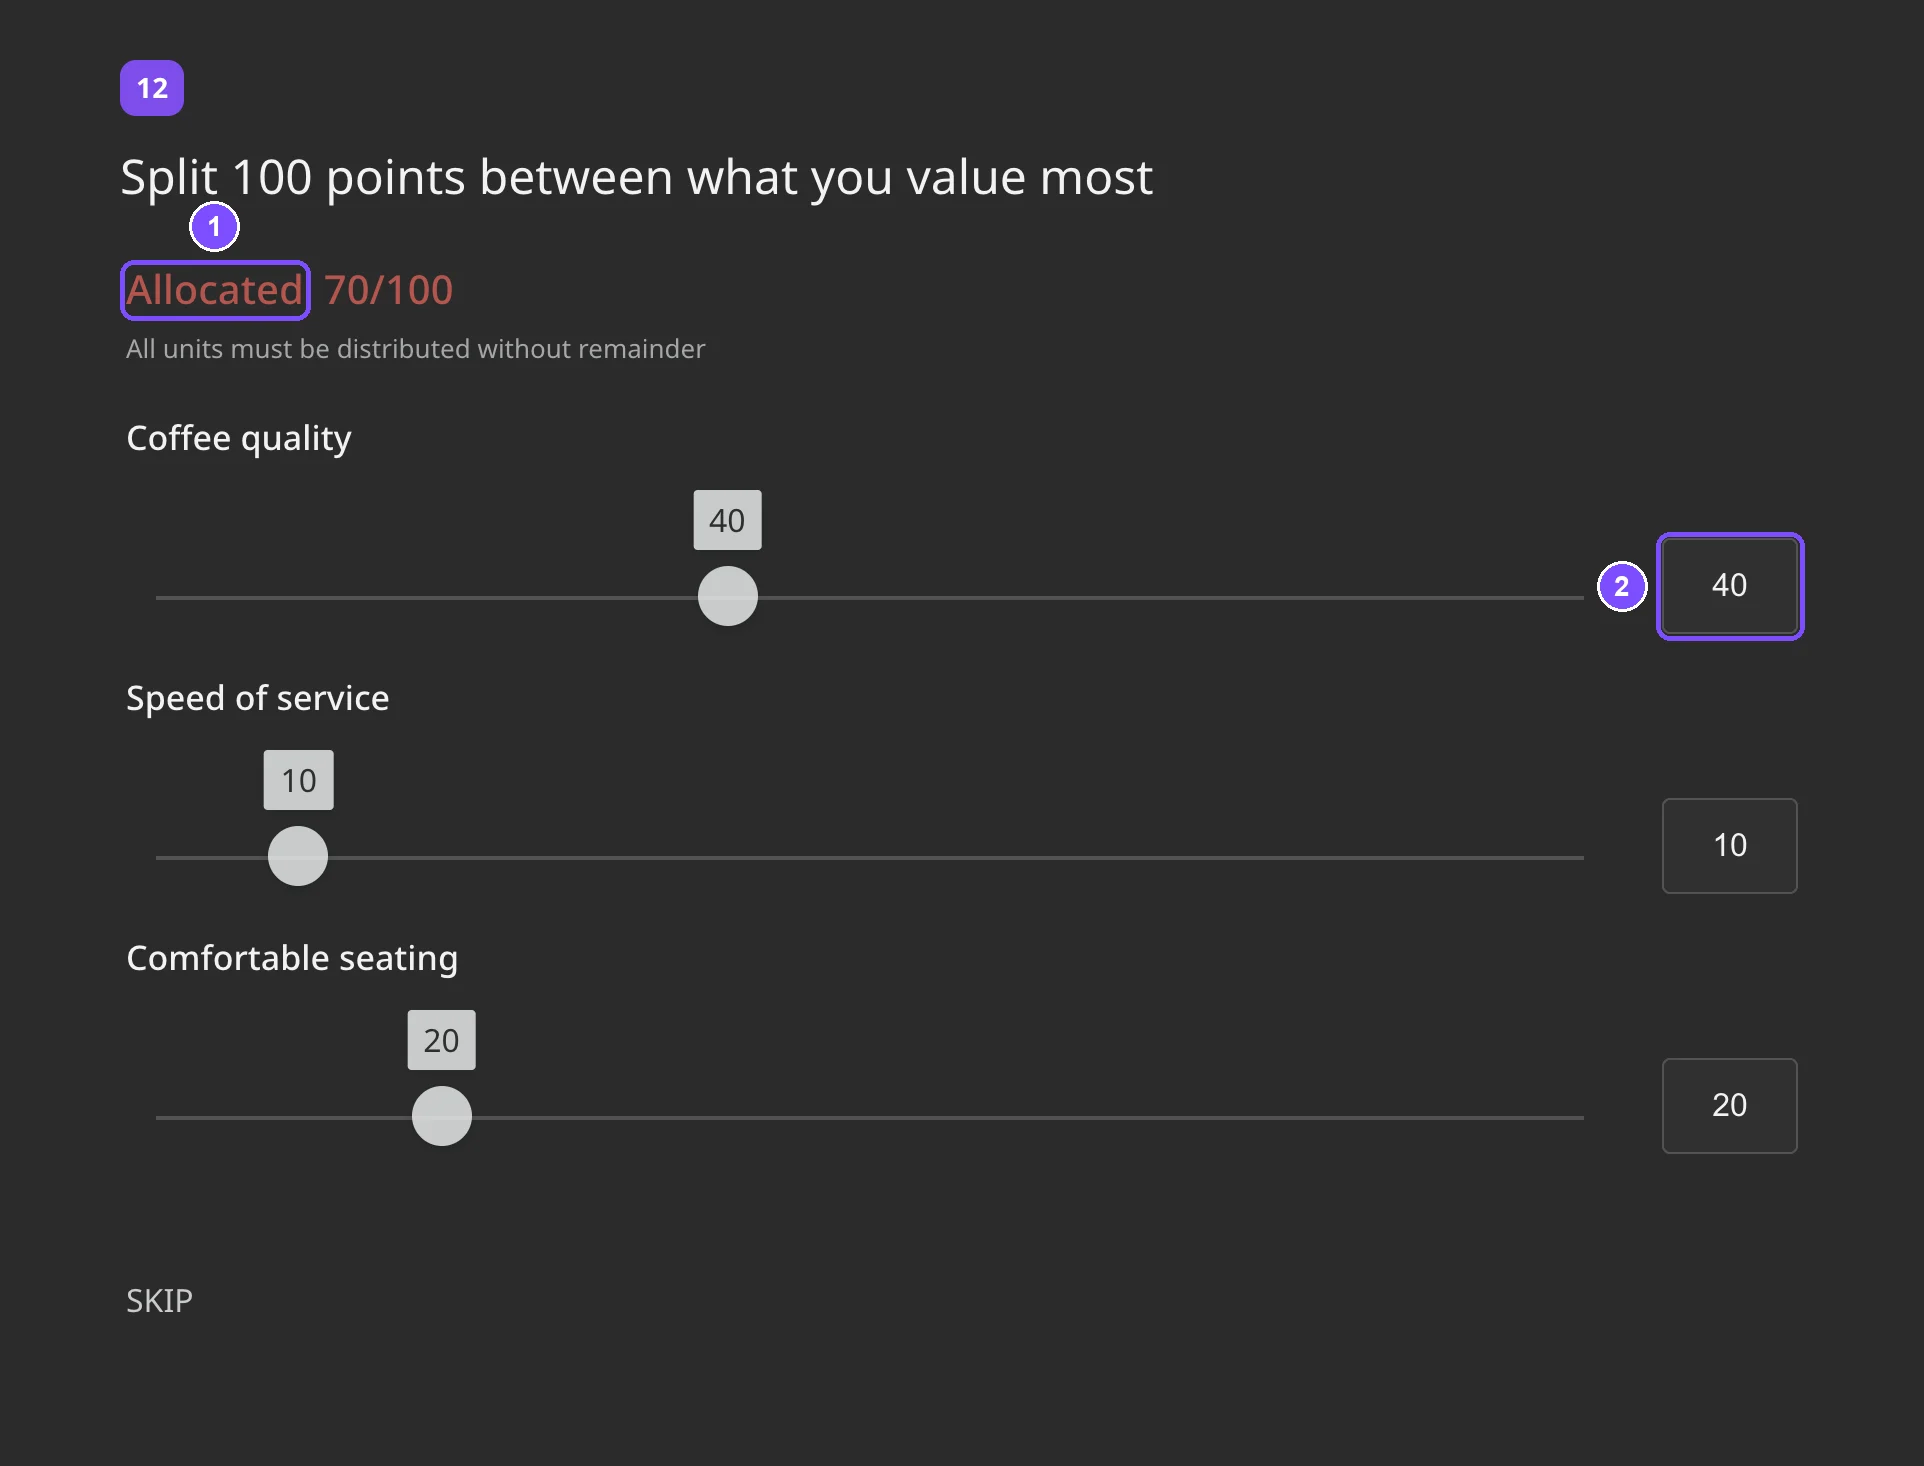
At the top is the counter, for example "Allocated 70/100". Each option has a slider and a number field: the respondent drags the slider or types a number. An option can't get more than the points left: the slider stops there, and the counter flashes. On a phone, the layout is the same.
If Without remainder or Require rating of all options is on, a hint under the counter explains the rule, for example All units must be distributed without remainder. The counter turns red while the answer breaks the rule.
Responses and report
In Results → Reports, each option shows the average number of points it got:
- Bars: a bar chart of the averages.
- Table: the option, the average (the column is named after the counter, Allocated by default) and the number of responses.
Options with higher averages matter more to your respondents. Averages include responses that gave the option 0 points.
In a CSV or XLSX file, the question takes one column: "Taste: 60, Price: 10, Speed: 30 (Allocated)". Options with 0 points are left out, and the counter label is added in parentheses. See Viewing and Downloading Survey Responses.
To filter responses, add the question in the report filter, pick an option and compare its points with a number (Basic plan and higher).
Logic and scores
In logic jumps, pick an option, then compare its points: Less than, More than, Equals and others, or Is answered. For example, respondents who gave Price more than 40 points go to a question about discounts. Allocation slider questions don't have scores.
Limits
- From 2 options. Units: from 1 to 10,000.
- Points are whole numbers.
- Allocation slider can't be used in micro surveys.