


 25 Questions for a Construction Customer Satisfaction Survey
Survey Summary
Updated
On this page
The Summary tab shows the whole survey at a glance: how many people opened it, how many finished, where they come from and how long it took them. To see the answers to each question, use the report instead.
Opening the summary
- Open the survey and click Results in the top menu.
- In the second row, click Summary.
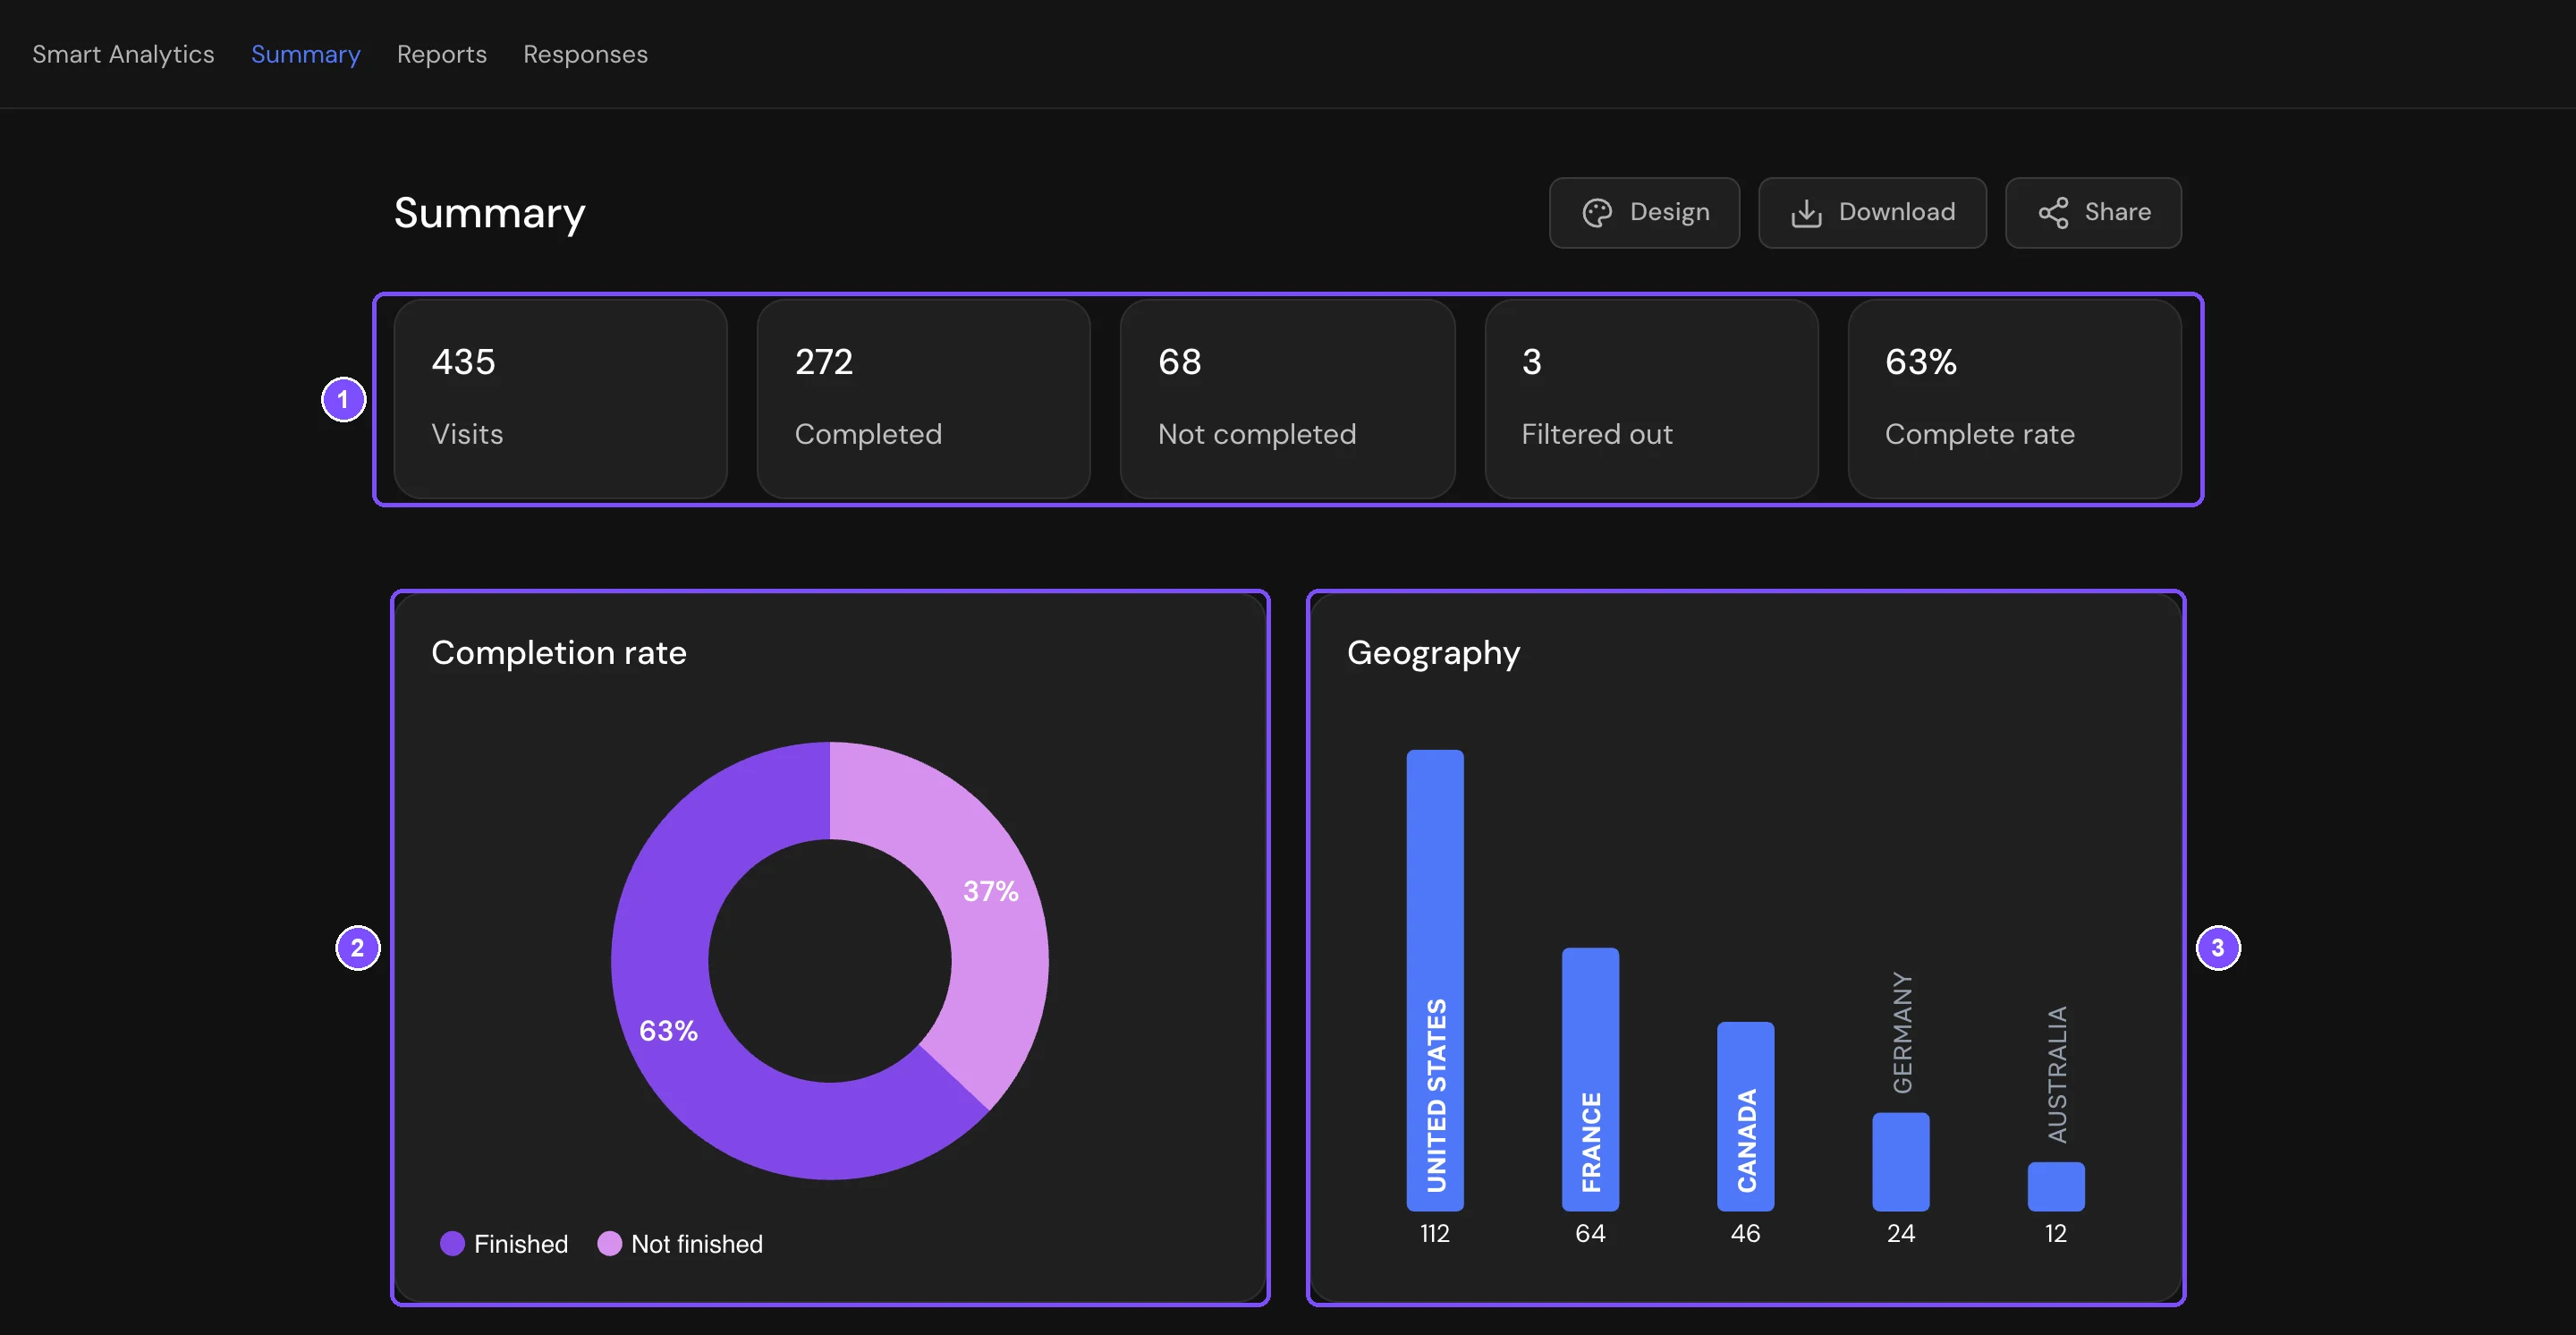
If the survey has no visits and no responses yet, the page shows "Nothing here yet...".
Number cards
The row at the top (1) has five numbers for the whole life of the survey:
| Card | What it counts |
|---|---|
| Visits | Unique visitors who opened the survey. Opening it again in the same browser doesn't add a visit. Opening the preview doesn't count. |
| Completed | Responses that reached the end of the survey. Disqualified responses aren't included. |
| Not completed | Respondents who started but left before the end. See Incomplete Responses. |
| Filtered out | Respondents screened out by disqualification or a quota. |
| Complete rate | Completed divided by Visits, as a whole percent, never above 100%. |
The Completion rate chart (2) shows the same percentage as a ring.
Charts
- Geography (3): up to 10 countries with the most respondents who completed the survey. A country that couldn't be detected from the IP address is shown as Not specified.
- Responses by day: the number of responses per day. Switch the chart between Completed, Not completed and Disqualified. Completed and disqualified responses are counted on the day they were finished, incomplete ones on the day they were started.
- Visits by day: unique visitors per day.
- Devices: the share of completed responses from Desktop, Mobile and Tablet.
- Average time: how long a completed response takes on each device type, from opening the survey to finishing it.
Days are counted in the time zone of the survey owner's account (Time zone in account settings).
If the survey is an Anonymous survey, Geography, Devices and Average time show "Data not available yet". This applies to all responses, including the ones collected before the setting was turned on.
Visits for a period
The summary always covers the whole life of the survey. To count visits for specific dates, use the Visits by day chart:
- Find the hint "drag along the chart to select a period" in the chart header.
- Hold the mouse button and drag across the days you need.
- Release the button. The chart shows the number of visits for that range, for example "125 visits from 01.10 to 07.10".
- To clear the range, click reset selection.

The range works only with a mouse: on a touch screen, dragging scrolls the page. It changes only this chart, the cards and other charts stay the same.
Note. The number for a range is the sum of the daily bars. A person who opened the survey on 2 different days counts on both days, so the sum for all days can be higher than the Visits card.
Filters from the Reports tab don't apply to the summary.
Which responses are counted
The summary doesn't count:
- deleted responses;
- responses you hid with Hide. See Deleting Responses;
- responses hidden because the monthly response limit of your plan is used up, until you pay for them;
- responses under moderation. In that case the summary shows the Moderation responses banner with their number; they're added after the review.
Downloading and sharing the summary
The icons in the top right corner of the summary work the same way as on the Reports tab:
- Design: colors of the charts. They're shared with the report. See Changing chart colors.
- Download: the summary as a PDF file.
- Share: a public link to the summary that anyone can open without an account. See How to Share Results.
Download and Share become active after the first visit or response.
A micro survey on your website has its own summary with views, opens, dismissals and display pages.
Limits
- The summary is available on all plans.
- Download and Share work on the Basic plan and higher. On the Free plan, clicking them opens an offer to upgrade.
- Incomplete responses are saved only on the Premium plan and higher. On lower plans, new incomplete responses don't reach Not completed, and the Not completed view of Responses by day is empty.
- The summary has no date or device filter. The only period tool is the range on Visits by day.