


Net Promoter Score (NPS) Question
Updated
On this page
The NPS question asks "How likely are you to recommend us to a friend or colleague?" and shows a scale from 0 to 10. In the report, SurveyNinja turns the answers into the Net Promoter Score: the share of loyal customers minus the share of unhappy ones. The same question works for employee surveys (eNPS): "How likely are you to recommend our company as a place to work?"
Adding an NPS question
- In Builder, click + above or below a question.
- In the Scales and ratings section, click NPS.
- Type the question, for example "How likely are you to recommend Brew & Bean to a friend?".
- Click the labels under the scale and type your own text, for example "Not at all likely" and "Extremely likely".
More about adding questions: Question Types.
Settings
The scale of the NPS question is always 0 to 10, so it has no Start at and Steps settings. Click Settings (the gear) on the question to turn the labels on or off:
| Setting | What it does |
|---|---|
| Left label | Text under 0. "Bad" by default. |
| Center label | Text under 5. "OK" by default. |
| Right label | Text under 10. "Excellent" by default. |
The label texts also name the three groups in the report, so it's worth changing the defaults. For example, write "Not at all likely" in the left label and "Extremely likely" in the right one, and turn off the Center label.
Shared settings such as Required response and Add “Prefer not to answer” are described in Question Settings.
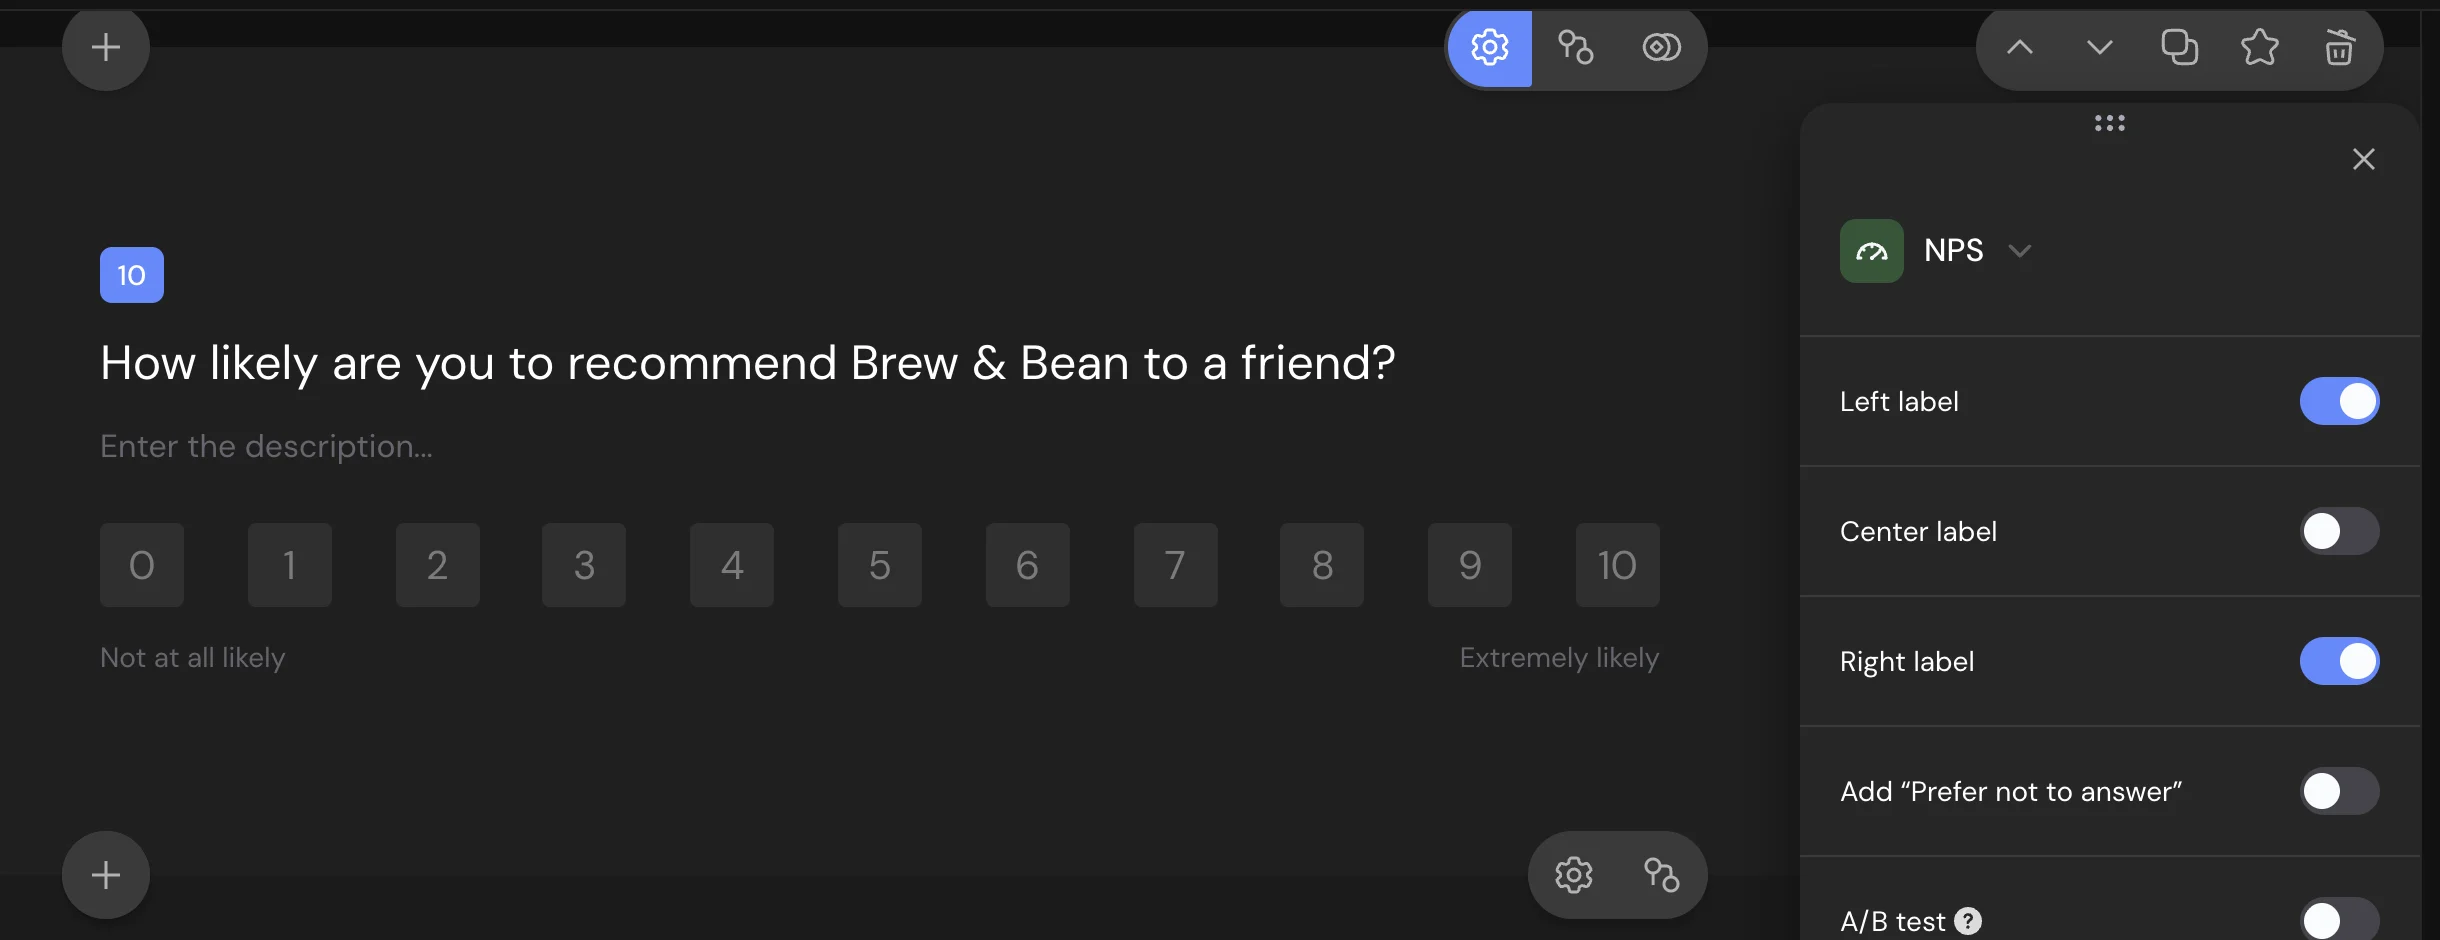
What respondents see
Respondents see 11 buttons from 0 to 10 with the labels under them. If the row doesn't fit the screen, for example on a phone, the buttons join into one solid bar. When the Center label is on, the labels then move into a column with their numbers, like "0 > Not at all likely". After a click, the next question opens by itself, unless Disable auto-advance to the next question is on in the survey settings or the question is in a Question Group.
How the report calculates NPS
In Results → Reports, the NPS card splits the answers into three groups:
| Answer | Group | Shown in the report as |
|---|---|---|
| 9–10 | Promoters | the text of the Right label |
| 7–8 | Passives | the text of the Center label |
| 0–6 | Detractors | the text of the Left label |
NPS = the percentage of promoters minus the percentage of detractors, rounded to a whole number. It ranges from −100 (everyone gave 0–6) to 100 (everyone gave 9–10). For example, out of 200 answers, 90 are 9–10 (45%), 70 are 7–8 (35%) and 40 are 0–6 (20%). NPS = 45 − 20 = 25.
Next to the NPS, the card shows the number and the share of answers in each group. Below, switch between Table (every score with its group) and Bars (colored by group).
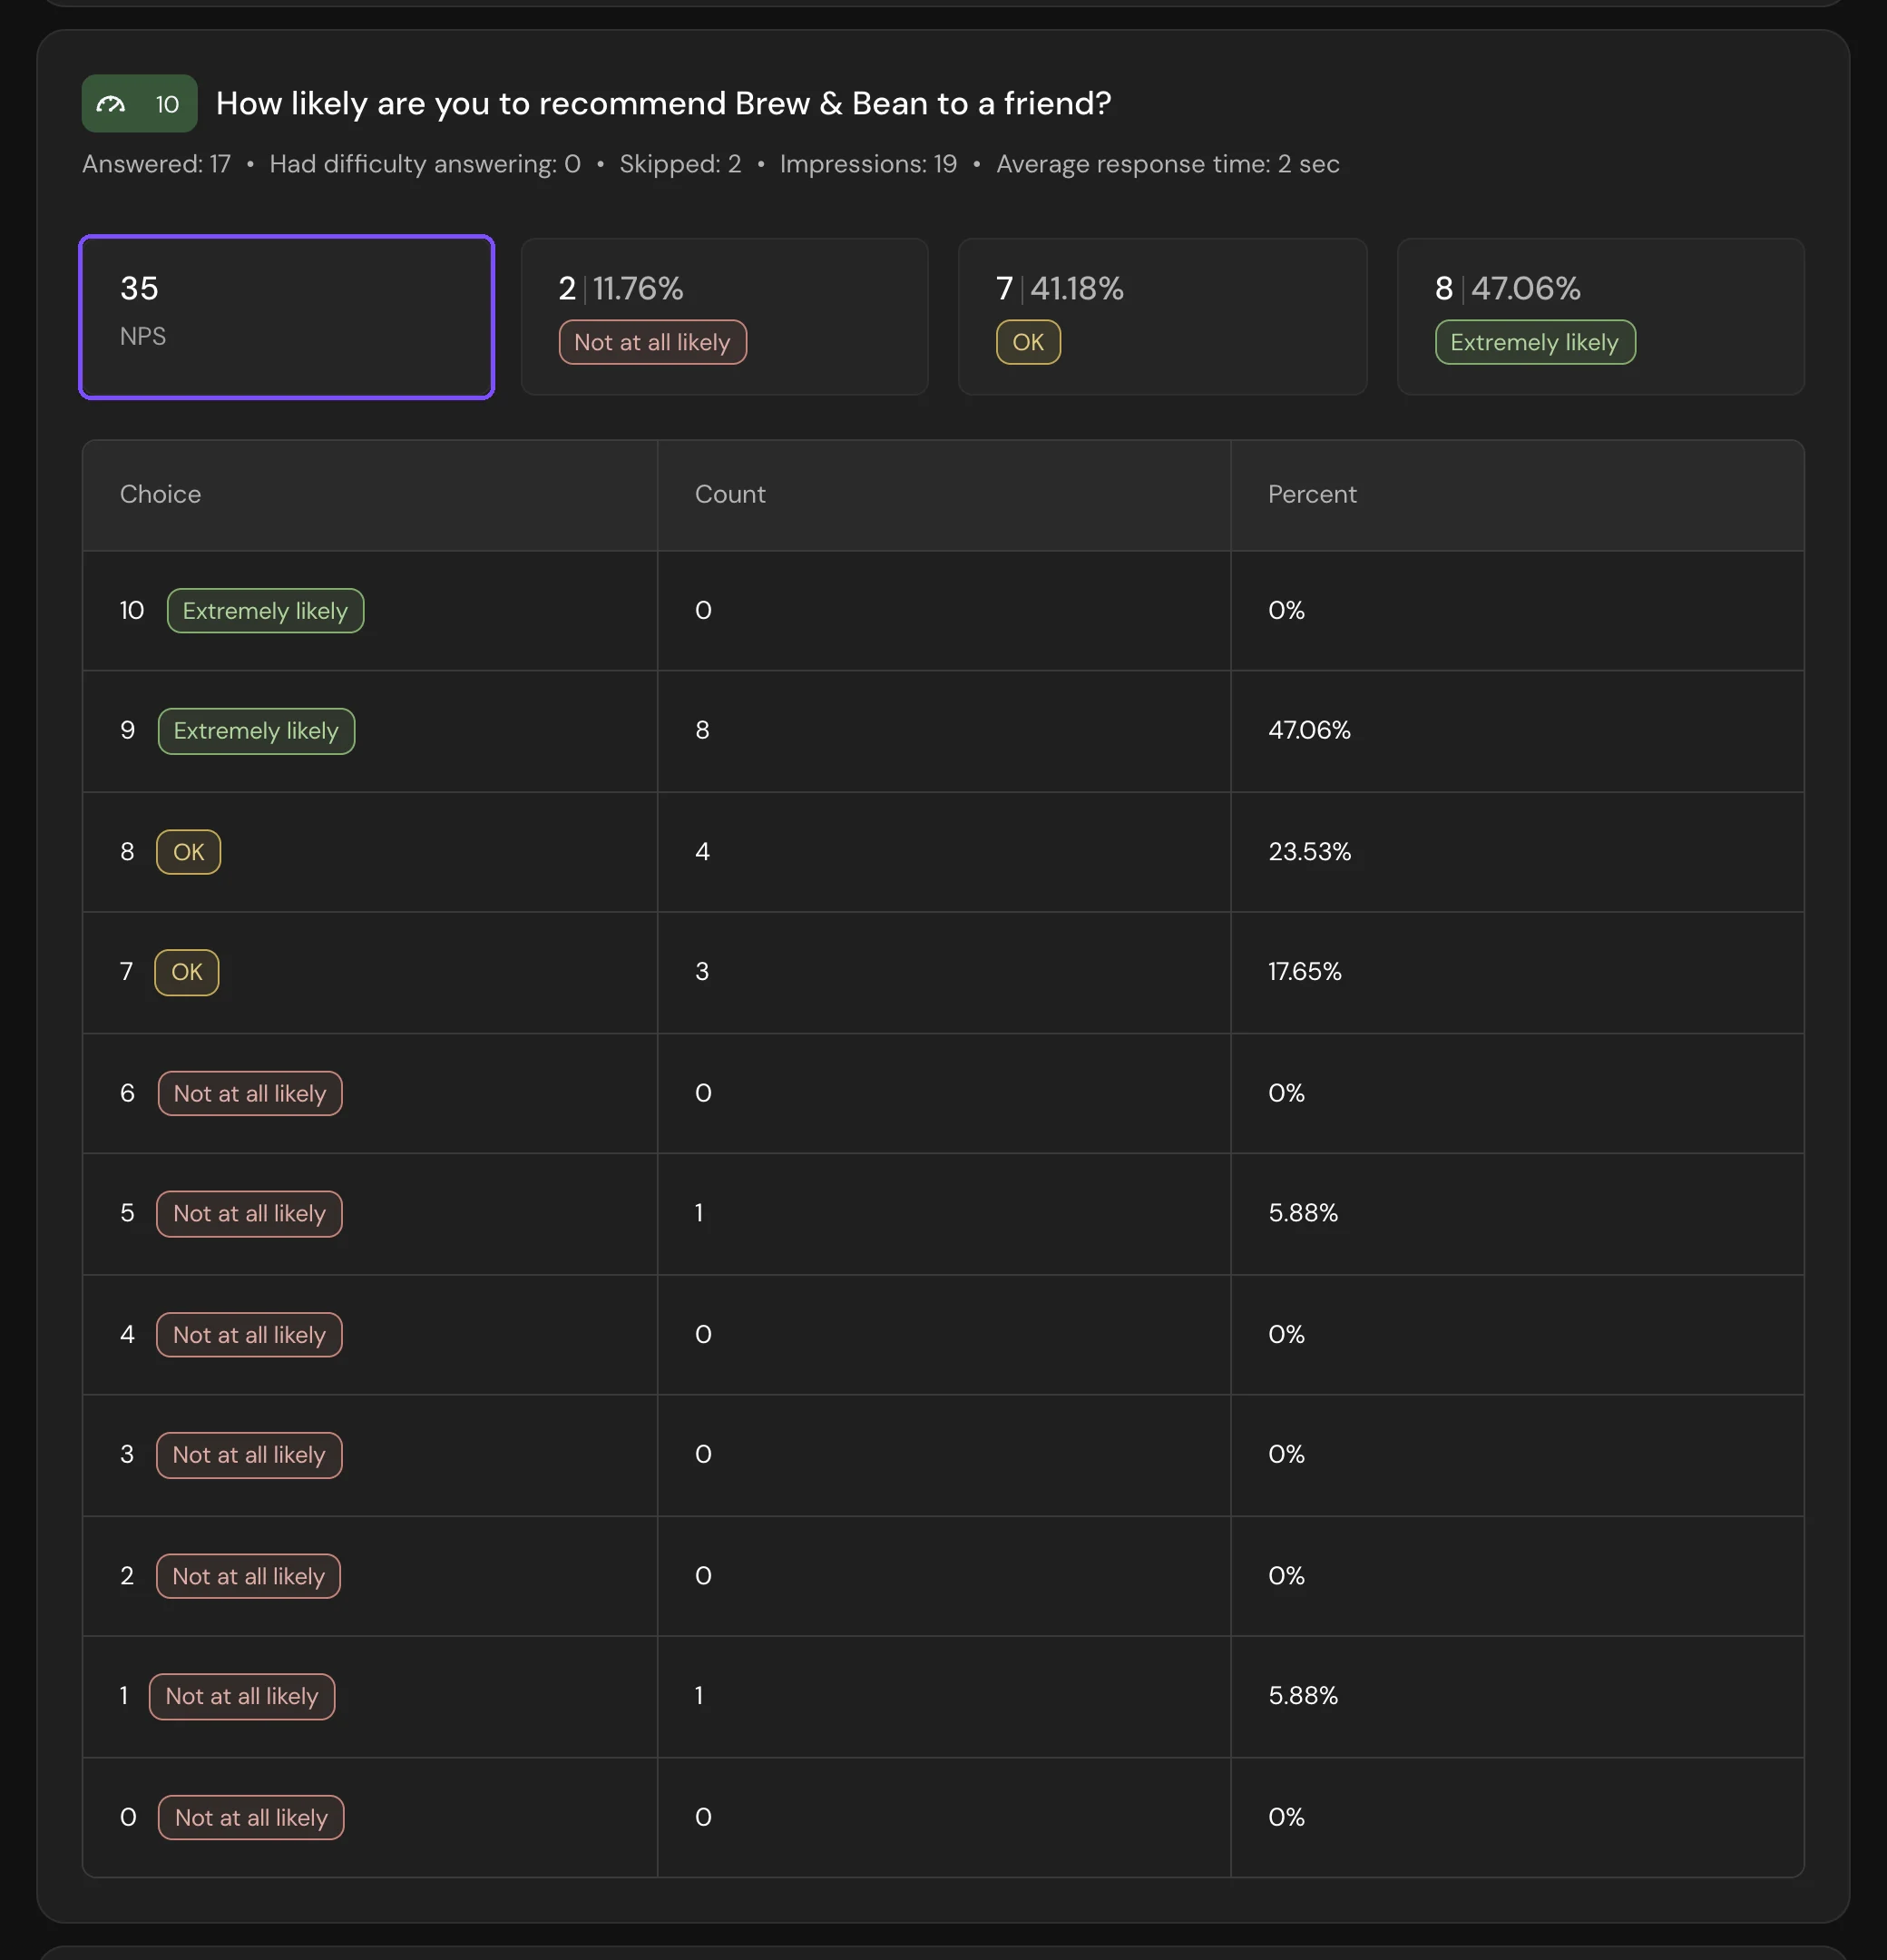
In CSV and XLSX files, the answer is one column with the number from 0 to 10. To see who gave a certain score, use Filter by answers (Basic plan and higher) and enter a number. See Viewing the Survey Report.
Asking why after a low score
The score alone doesn't say what to fix. Add an Enter Text question after the NPS question, for example "What should we improve?", and use logic jumps (Basic plan and higher) to send only detractors there:
- Open Logic Jumps on the NPS question and click Add logic jump.
- In IF, choose Less than or equal to and 6.
- In THEN, choose Go to and the "What should we improve?" question. Click Save.
Set where the others go under In other cases.
Logic and scores
The NPS question has the conditions Less than, Less than or equal to, More than, More than or equal to, Equals, Does not equal and Is answered. It can give points for each score. See Scores, Correct Answers and Personality Tests.
Limits
- The scale is fixed at 0 to 10.
- The report always groups answers as 0–6, 7–8 and 9–10.
- An Opinion Scale set to 0–10 also gets the NPS calculation in the report. If you switch an Opinion Scale to the NPS type, its range changes to 0–10.