


Smart Analytics: AI Report on Responses
Updated
On this page
Smart Analytics reads the responses to your survey and builds a report with AI. The report has three sections: text analysis of open-ended answers, comparison of respondent groups and quantitative analysis of closed-ended questions. The feature is in beta.
Paid feature. Available on the Premium plan and higher. Compare plans
What the report needs
The report is built from completed responses. Incomplete and disqualified responses are not counted. You need at least 5 completed responses. Until the survey has enough, the page shows More responses needed with the current count.
Each section works with its own question types:
| Section | What it shows | Questions it needs |
|---|---|---|
| Text analysis | Sentiment and topics of open-ended answers, what people praise and complain about, typical quotes | Enter Text or Full name |
| Comparative analysis | How ratings differ between groups of respondents and which factors affect them most | Two questions: a rating (Rating, Smile rating, Opinion Scale, NPS or Slider) and a single-answer question that splits respondents into groups (Radio Button, Yes or No or Dropdown) |
| Quantitative analysis | Metrics, distributions and key findings | Closed-ended questions: Radio Button, Multiple Choice, Dropdown, Yes or No, the rating questions listed above, Numerical Response, Date and Time, Ranging, Matrix |
If a survey has no suitable questions for any section, the page shows No suitable questions and lists what each section needs.
Creating the report
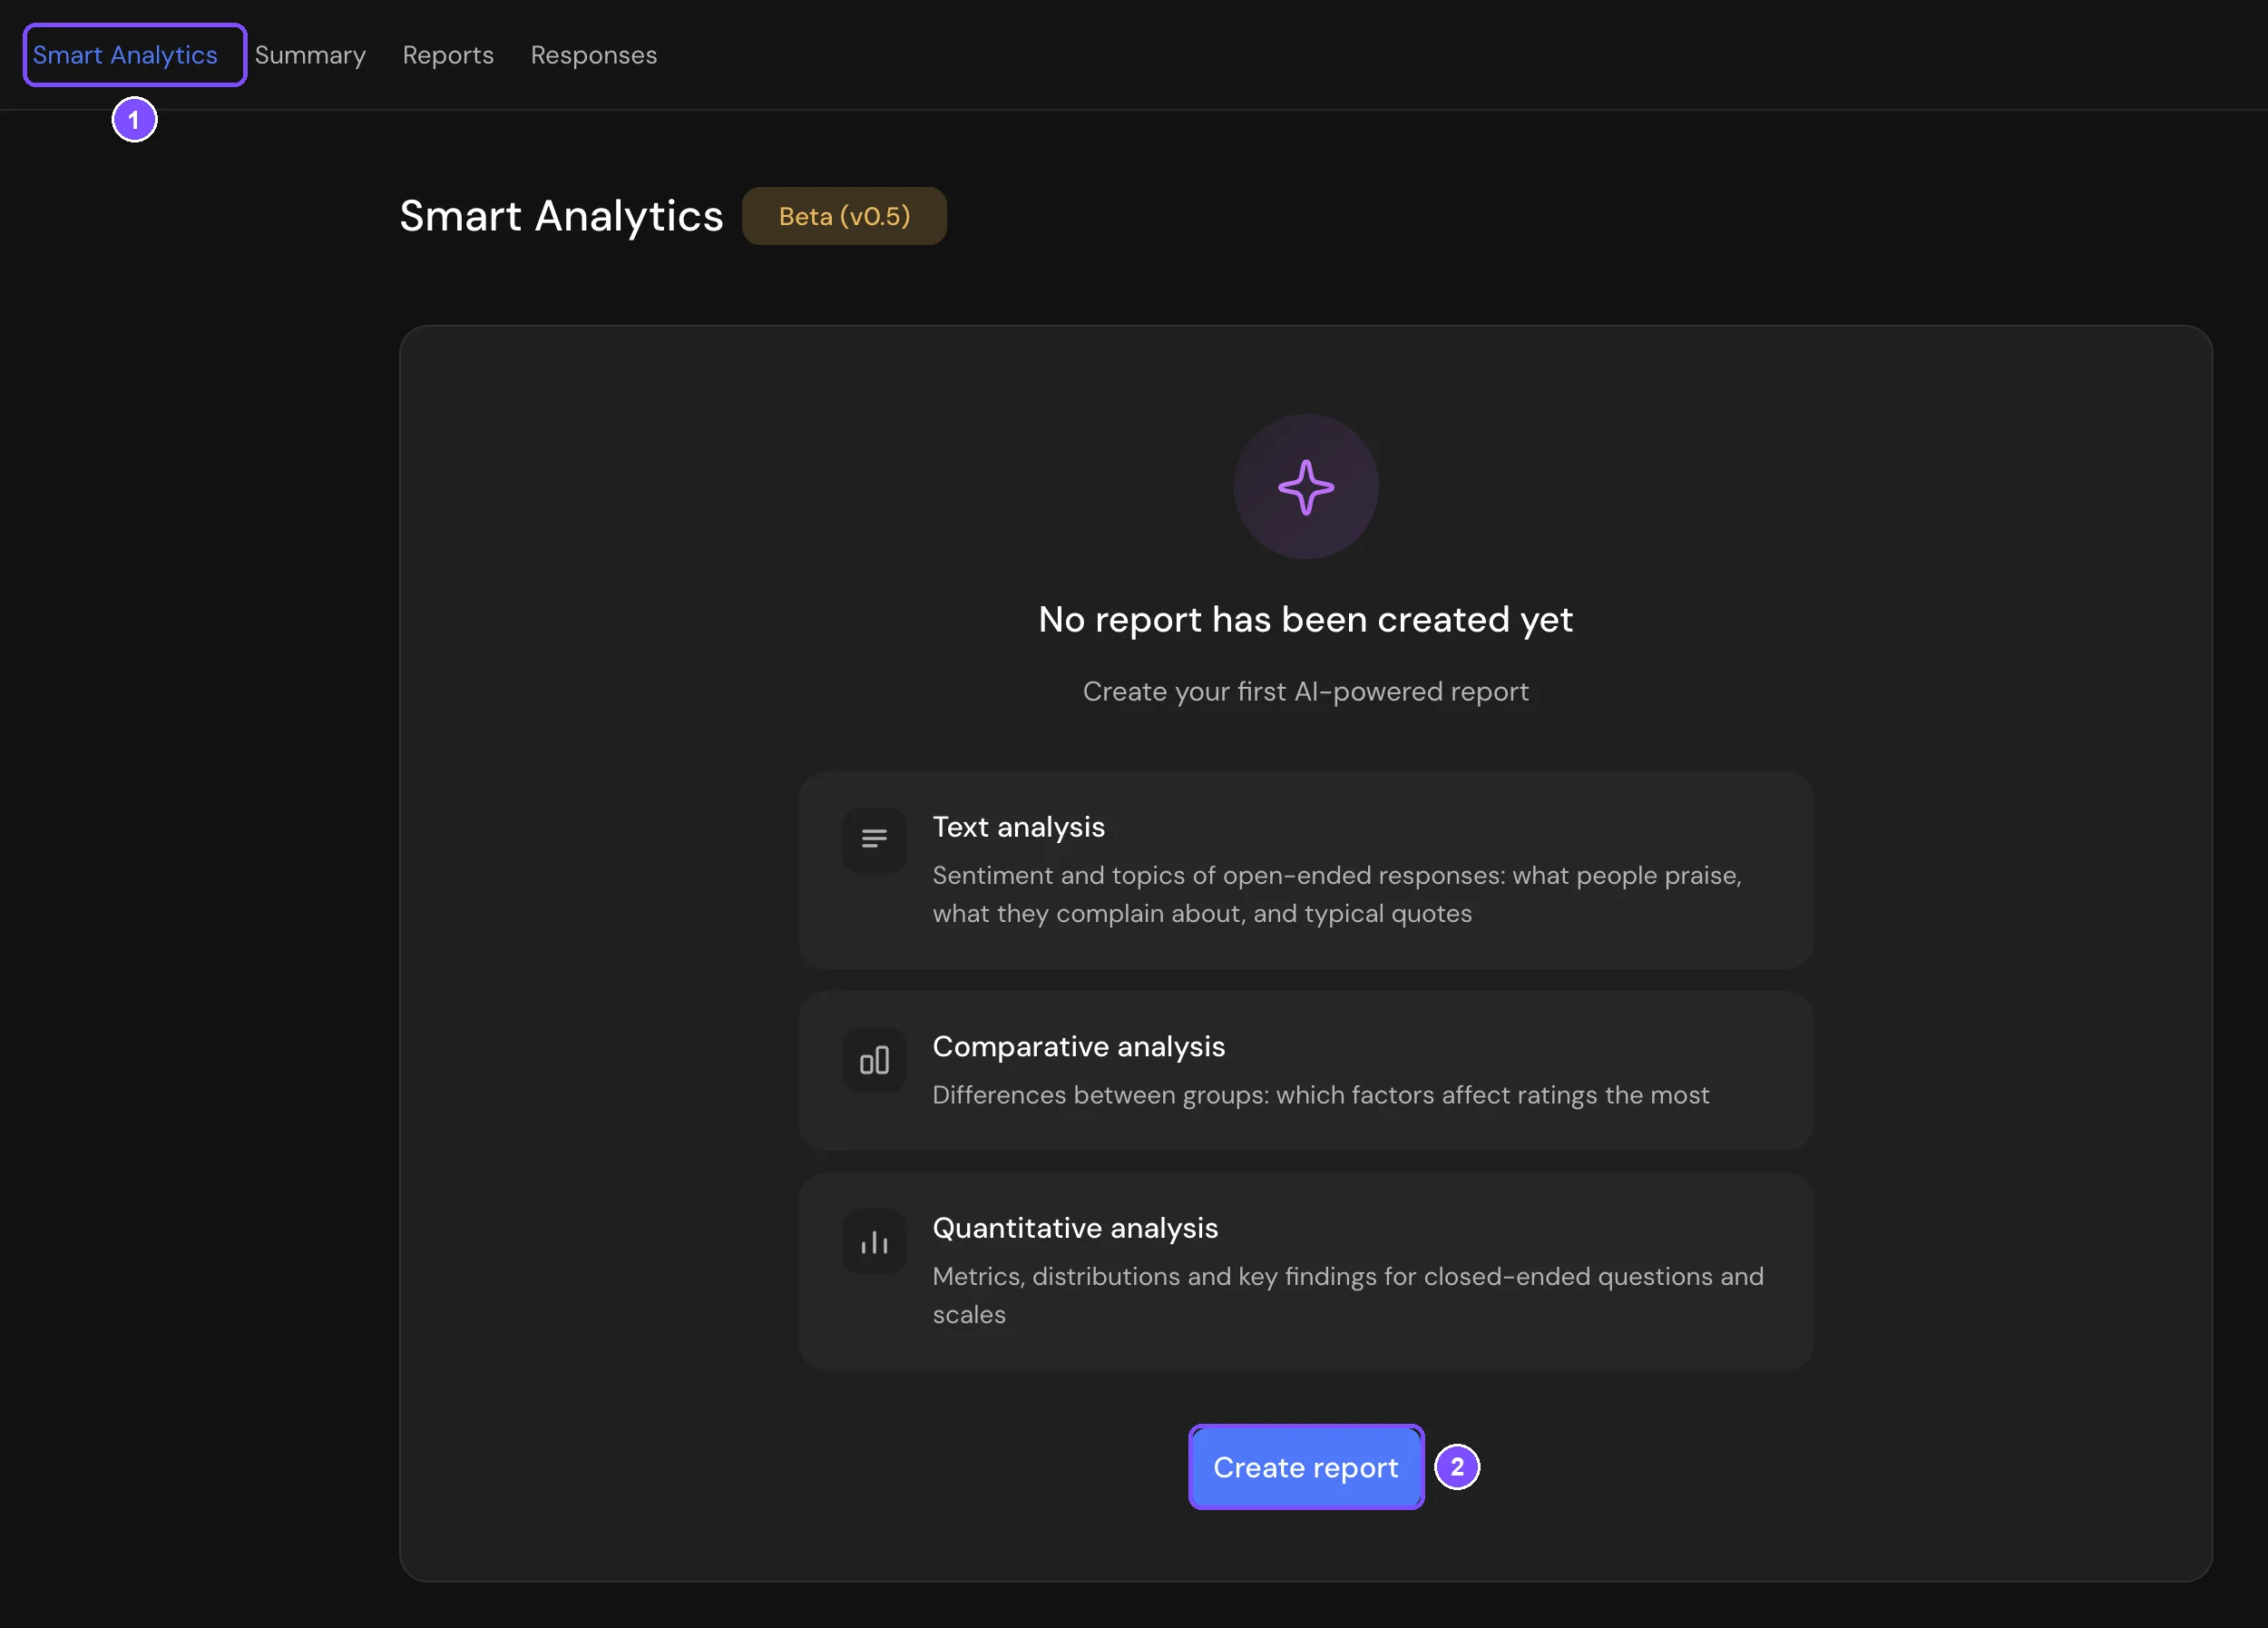
- Open the survey and go to Results → Smart Analytics (1).
- Click Create report (2).
The Generating the report screen shows the progress of each section. It usually takes less than a minute. Generation continues on the server, so you can leave the page and come back later.
What's in the report
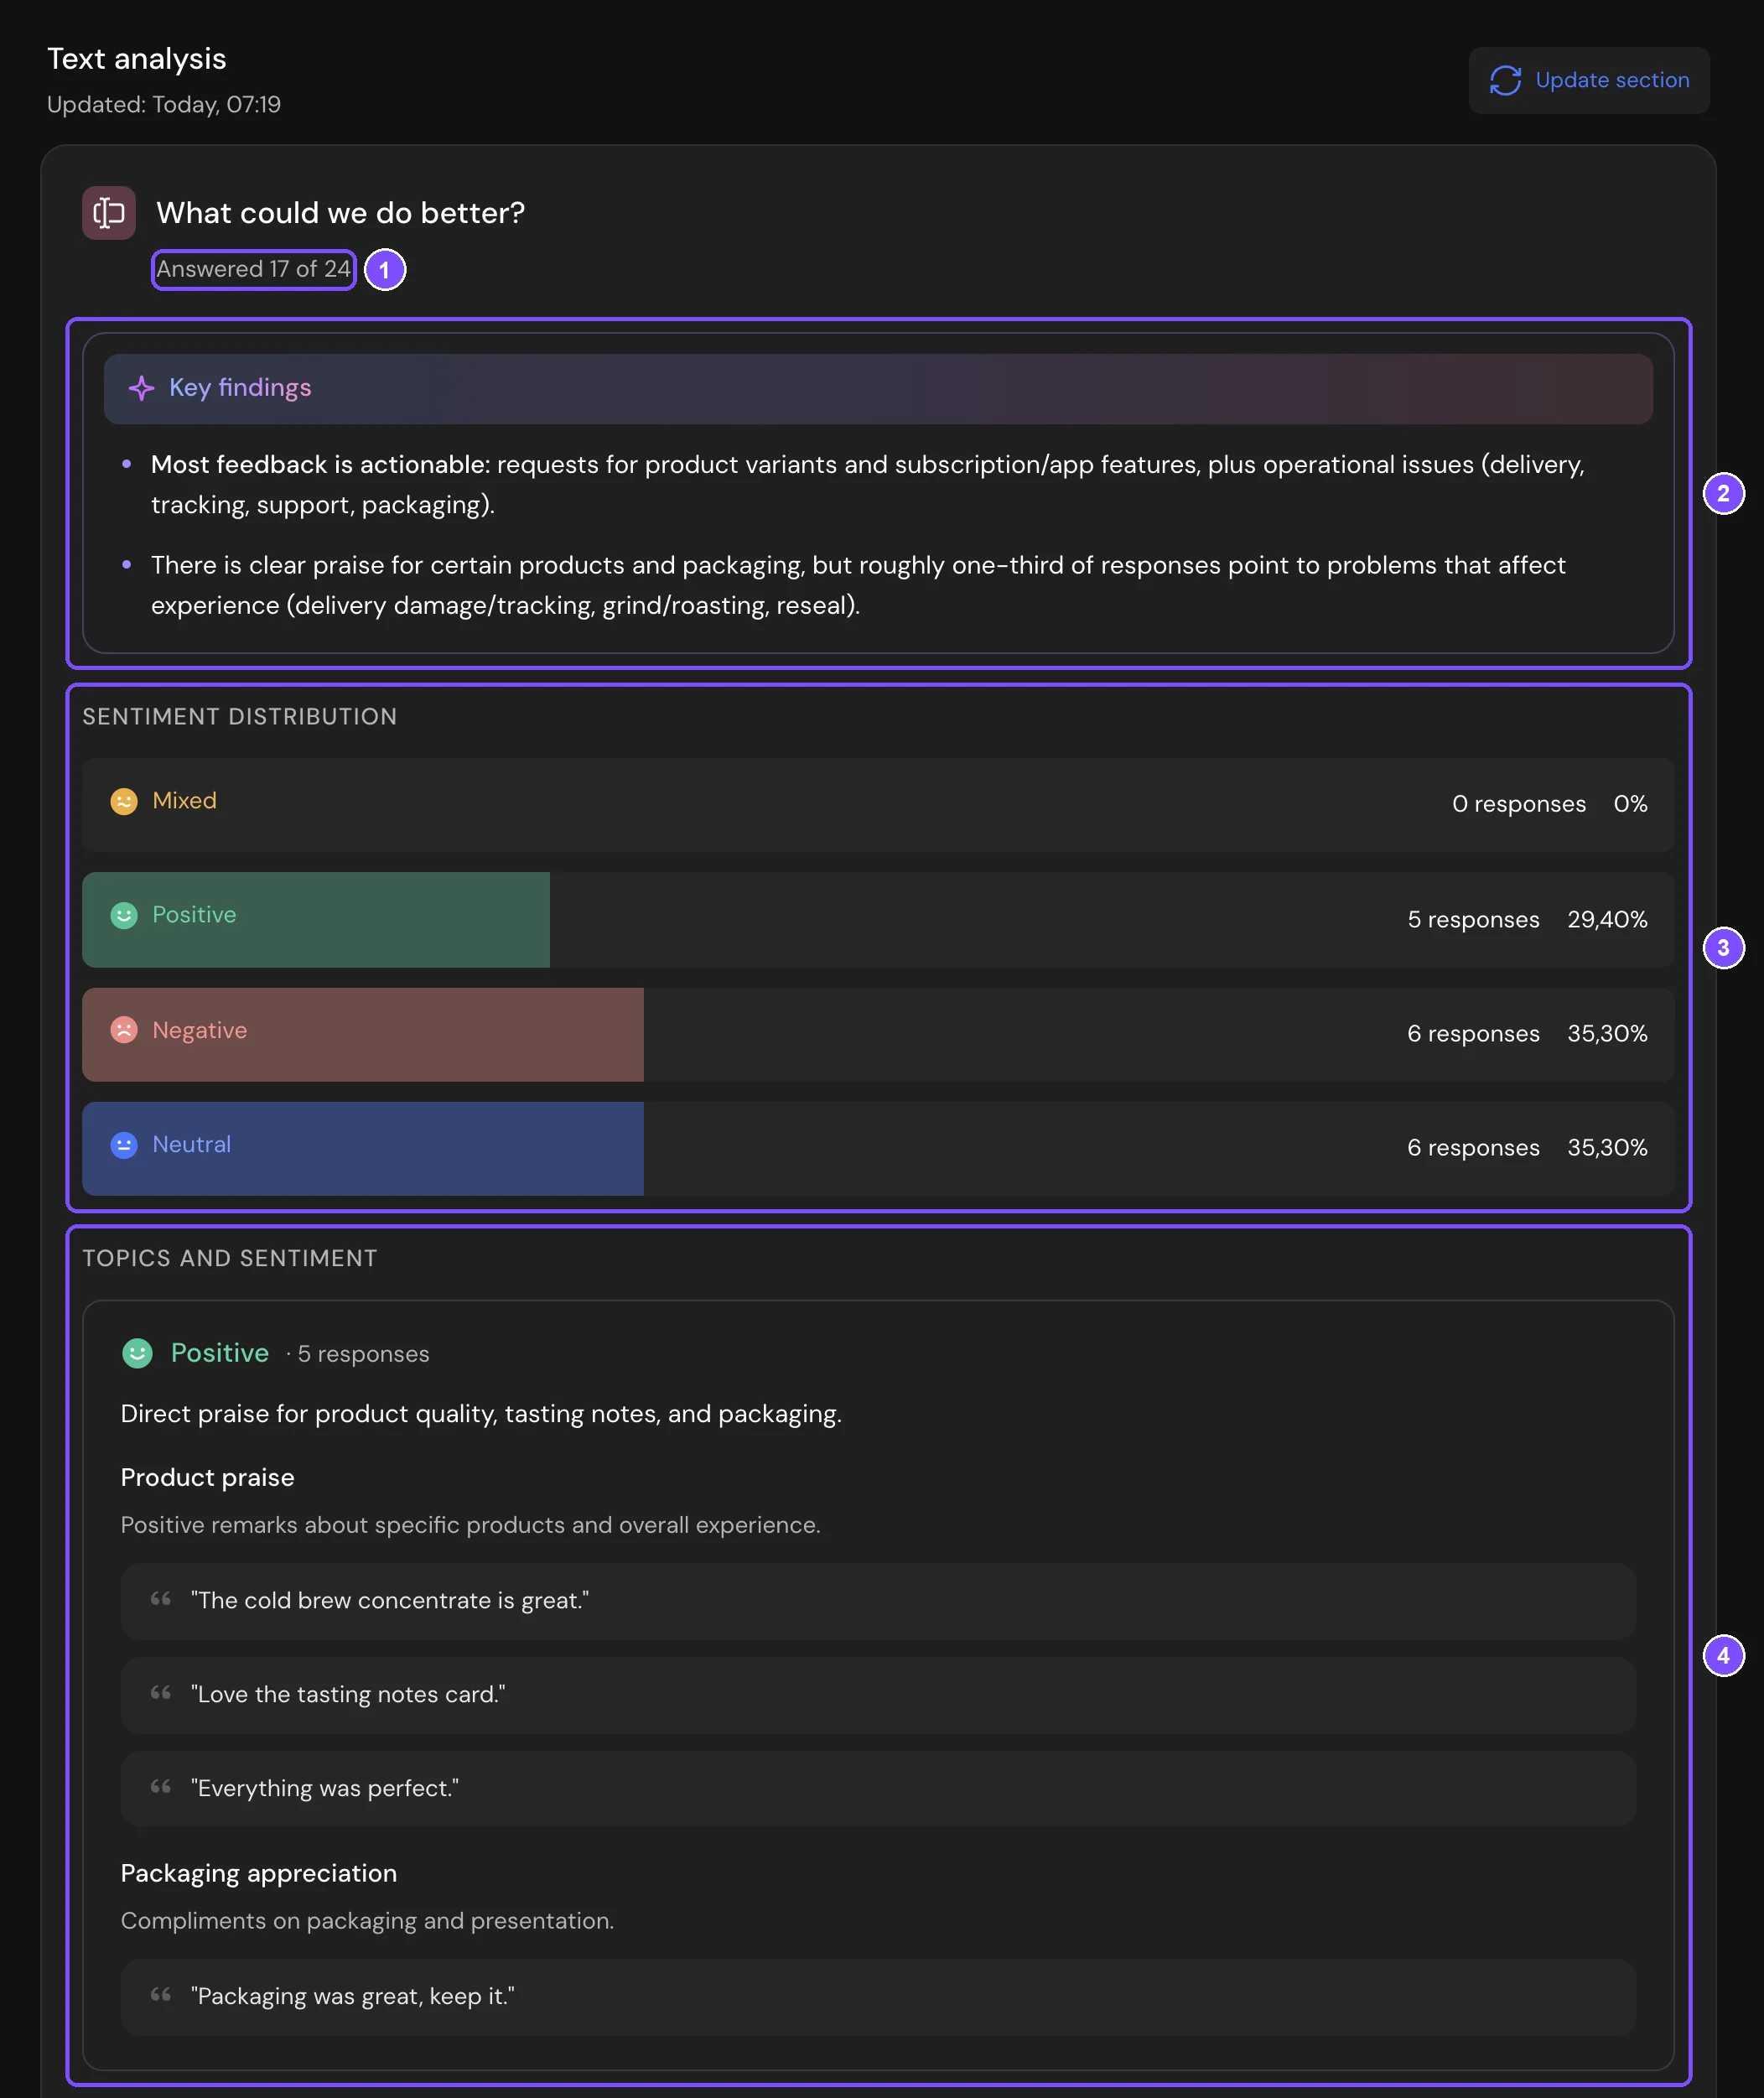
Text analysis. For each open-ended question you see how many respondents answered (1), Key findings (2), Sentiment distribution across Positive, Negative, Neutral and Mixed (3), and Topics and sentiment with typical quotes (4).
Comparative analysis. Each card is one finding. Next to its title is the strength of the effect: Strong impact, Moderate impact, Weak impact or No impact. Below are the rating question (Metric), the question that splits respondents into groups (Comparing groups) and the score of each group. What it means explains the finding.
Quantitative analysis. For each closed-ended question you see the Main insight, key numbers, a chart and Key findings.
If a section has nothing to show yet, it moves to Coming later at the bottom of the page with the reason. For example, the comparative section appears only when the groups differ noticeably.

Note. The report is written by AI and can contain mistakes. Check important numbers in Reports before you share them.
Updating the report
Above the report are Design, Download, Share and Update report, and links to the sections of the report.
The report doesn't update by itself when new responses arrive. A badge on Update report shows how many responses have come in since the last update.
- Update report at the top of the page updates all sections.
- Update section next to a section title updates only that section.
A section is rebuilt only when at least 100 new responses have arrived since its last update. If there are fewer, you see a message that the report is up to date and how many new responses there are. If an update fails, the previous version of the section stays on the page with the Failed to update label.
Downloading and sharing the report
To download a PDF:
- Click Download at the top of the report.
- In Download AI report, select PDF and click Download.
To share a link:
- Click Share.
- In Share AI report, copy the link or share it on social networks.
Anyone with the link can view the report without signing in to SurveyNinja. The link always shows the latest version of the report, including later updates.
Limits
- Your plan limits how many surveys in the workspace can have an AI report. Updating an existing report doesn't use the limit. Deleting a survey frees up its place.
- The report is written in the interface language of the person who creates or updates it.
- Text analysis reads up to 400 answers per open-ended question.
- The report can be downloaded only as a PDF.
If the report isn't available
- The page shows the Upgrade plan button. Your plan doesn't include Smart Analytics. It's available on the Premium plan and higher.
- More responses needed. The survey has fewer than 5 completed responses. Wait for more responses and open the page again.
- No suitable questions. The survey has no questions that any section can analyze. The page lists which question types each section needs. The message can also appear when all closed-ended questions in the survey are Radio Button or Multiple Choice. In that case, write to support.
- No access. You don't have permission to view the results of this survey. Ask the workspace owner to change your role.
- AI report limit reached. All AI reports on your plan are used. The message shows how many reports are used and how many your plan includes.